
If 2021 was the start of our return to travel and adventure, 2022 was the apex. We spent nearly half the year away from home as the pandemic waned. Our FIRE budget suffered, up by about 12% to $57,439. And while it’s a little late—coming to you at the tail end of 2023!—this post reveals how we handled 2022’s inflation and our FIRE budget.
Each year, Jenni and I break down our annual expenses to compare our current selves to our past—to see if we’re sticking with our spending trends over time. The expense data forms our annual FIRE budget basis.
As two 38-year-olds in a walkable area of Virginia, we feel like we have pretty typical modern lives with all the creature comforts one might desire. For years, our spending trended downward. But a trailing pandemic and significant inflation in the US (6.5% in 2022) has raised our costs.
We hope revealing the details of our spending in this FIRE budget will inform your own spending goals. Perhaps it will lead you to a few tricks of how we keep our spending low and spend less than we earn.
While this post doesn’t include information on monthly income or net worth changes, our monthly budget updates do. Since May 2020, we’ve detailed each monthly budget on TicTocLife. You can dig into the numeric details of how we’ve reached FIRE through those budget reports.
Why have a FIRE Budget?
Jenni and I started tracking our combined expenses as a couple in 2016. By doing so, we can monitor for developing trends—if our combined restaurant expenses are on the rise, it might be indicative of a problem we need to address.
But, the data can also be reassuring.
For example, we both felt we were spending a lot more on groceries in 2020. It turned out we spent much less overall because we were able to save so much money through grocery rebates.
Throughout 2021 and 2022, we were worried how traveling for months of the year would blow up our budget—and it did—but perhaps not quite as much as we thought. It’s worth it to us.
We walk through all these categorical spending details below and hope that you find some diamonds in the rough to help build your sustainable FIRE budget.
2022 FIRE Budget
Before we get into the nitty-gritty, let’s take a look at the 50,000-foot view of our FIRE budget in 2022.
We’ve produced a pie chart below that reveals the biggest spending categories for us.
With no surprise, our Home continues to be our most costly spending category. We’re happy to continue our 3.625% mortgage and relatively low maintenance.
Given how much time we’ve spent away from home (nearly half the year!), we’re also not surprised to see Travel as our second-highest expense.
We’ve done a great job of keeping our grocery expenses in line. Despite that, all the dining out while traveling raised our restaurant expenses enough to catapult Food & Dining into our third most costly category.
Let’s see how that compares to similar pie charts from 2021, 2020, and 2019 below.
It’s interesting to see inflation in action within our budget. Our major home expenses are mostly fixed. Over time, they’re requiring a smaller (relative) portion of our budget as everything else increases. Also, Travel went from being roughly 4% of our spending a few years ago to 18-22% over the last few years.
It’s great to see our Health & Fitness costs collapse as we’re moved onto ACA insurance and taken care of a few health issues.
Let’s dive into the details.

Expense details
Our categorized expense table below is grouped by parent categories (leftmost column), subcategories within that parent (middle column), and the amount spent (right column).
Parent categories are totaled on their row, summing all of the subcategory expenses below it.
Parent category names are linked to a short discussion about that category which follows the table.
As a point of reference, we live in a medium-cost-of-living, medium-sized city in Virginia, in the United States.
We live on the edges of a city proper so we generally walk to entertainment, parks, and stores. Despite the higher taxes and living costs, we figured that free entertainment, easy walking, and reduced commuting made city life a better choice for us than country living.
Categorized expense table
| Category | Subcategory | Spent ($) |
|---|---|---|
| Home | 20,505.35 | |
| Mortgage Principal | 4,720.24 | |
| Mortgage Interest | 5,327.60 | |
| Property Tax | 3,516.00 | |
| Insurance | 812.00 | |
| Improvement | 1,152.00 | |
| Service | 1,152.00 | |
| HOA Fees | 4,200.00 | |
| Lawn & Garden | 0.00 | |
| Supplies | 16.54 | |
| Furnishings | (391.03) | |
| Food & Dining | 7,944.09 | |
| Groceries | 4,190.48 | |
| Restaurants | 2,706.69 | |
| Fast Food | 631.67 | |
| Alcohol & Bars | 369.58 | |
| Coffee Shops | 45.67 | |
| Travel | 12,098.05 | |
| Hotel | 7,946.82 | |
| General | 0.00 | |
| Air Travel | 4,057.27 | |
| Rental Car/Taxi | 93.96 | |
| Health & Fitness | 5,609.45 | |
| Insurance | 3,301.88 | |
| Dentist | 259.00 | |
| Sports | 647.00 | |
| Doctor | 705.69 | |
| Pharmacy | 624.99 | |
| Eyecare | 70.89 | |
| Bills & Utilities | 1,526.81 | |
| Utilities | 981.52 | |
| Mobile Phone | 285.35 | |
| Internet | 259.94 | |
| Auto & Transport | 3,413.25 | |
| Gas & Fuel | 952.67 | |
| Insurance | 885.95 | |
| Parking | 39.50 | |
| Tolls | 140.00 | |
| Service & Parts | 575.16 | |
| Property Tax | 503.81 | |
| Public Transportation | 316.16 | |
| Entertainment | 887.17 | |
| TV & Movies | 13.00 | |
| Amusement | 837.63 | |
| Arts | 36.54 | |
| Shopping | 387.23 | |
| Electronics & Software | (100.55) | |
| Clothing | 198.81 | |
| Books | 0.00 | |
| Sporting Goods | 46.05 | |
| Toys & Hobbies | 242.92 | |
| Gifts & Donations | 822.39 | |
| Gift | 217.03 | |
| Charity | 605.36 | |
| Personal Care | 178.88 | |
| General | 178.88 | |
| Laundry | 0.00 | |
| Fees & Charges | 30.00 | |
| Bank Fees | 30.00 | |
| Service Fees | 0.00 | |
| Major Unbudgeted Expenses1 | ||
| Car Upgrade/Replacement (’08 Prius to ’11) | 1,000.00 | |
| HOA Assessment (Garage Rebuild) | 1,850.00 | |
| Subtotal2 | 47,390.72 | |
| GRAND TOTAL | 57,438.56 | |
| 4% SWR Basis3 | 1,435,964.03 | |
(1): Large, unplanned, and unbudgeted expenses can come up but should be infrequent.
(2): Defined as all expenses minus mortgage interest & principal—if we paid the mortgage off this is what we’d have spent.
(3): To maintain this level of spending, we’d need this much in appreciating assets to meet the classic “4% rule” (25x our annual expenses, the Grand Total number)
FIRE budget breakdown
We think that the expense numbers only tell half the story. For each spending category, we explain what expenses we incurred, why, and some spending strategies to help you manage your costs.
If you’re uninterested in the details, skip down to our overall review of our expenses.
Home
The Home budget category covers all things related to our housing. Our home purchase in 2013 included a 20% downpayment and a 30-year fixed rate APR mortgage near 3.8%.
Total mortgage principal & interest: $10,048.
No changes here! We’re happy to have a low-interest mortgage right now.
Property taxes ($3,516) remained even despite the market continuing its march upward, locally.
Home insurance ($812) is through Geico and was up about 2.7%. Our coverage is enough to cover replacement costs and has a high deductible scheme. We earn a slight discount on our home insurance by being shareholders of Berkshire Hathaway (and therein, Geico).
Home improvement and services ($2,304) are budgeted as 1% of the value of the dwelling (so 0.5% per). According to the FIRE budget above, we anticipate $96 per month for both improvement and service categories. So, $192/month over 12 months means a total of $2,304 per year, equating to a $230,040 dwelling.
Our real maintenance & improvement expenses this year were $281. With Jenni’s various labors, that went pretty far in improvements. Jenni redid her office lighting and redid our bedroom window paint/glaze.

Setting aside 1% of the value of the home each year has helped us smooth out the lumpy costs of maintaining a home.
The HOA fee ($4,200) may seem high at first glance, but the fee covers multiple utility-like expenses. The fee includes:
- Heating
- Water usage
- Landscaping
- Common area maintenance
- Garage maintenance
- Gutter cleaning
Our HOA is managed internally by fellow owners, unpaid. Fees end up flowing back to owners—and often in more collective, efficient ways. For example, a single commercial water boiler provides hot water for everyone. Our neighborhood was originally set up as a cooperative in the 1920s.
Home supplies ($17) include cleaning items, water filters, and so on.
Furnishings ($-391) ended up being a net positive category due to the sale of an Ekornes armchair. The vintage piece earned us a large enough chunk of change locally to cover our entire year’s small home furnishings purchases and still make a profit.
Food & Dining
Our grocery expenses ($4,190) jumped by 28% over the year. This is likely the category that which inflation was most clearly noticeable.
Egg prices have been on a tear all year, and that’s one of our favorite protein sources.
Of course, it’s been more than just eggs. We try to be flexible with our diets while maintaining a healthy, mostly pescatarian, mix of foods. And, we do our best to abide by the principles outlined in our expert how to save money on groceries post.
But, inflation and spending so much of our time away from our home grocery stores while traveling raised our grocery expenses.
Restaurant spending ($2,707) was up about 70% over 2021 levels. Worse, 2021 itself was about double that of 2020. But, much of this comes from spending more time traveling. As lockdowns lifted, so too did our desire to get away and return to the occasional restaurant experience.

Our fast-food budget ($632) was up almost 5x (!!) last year. Again, it’s almost entirely because of travel and post-lockdown desires for food adventures. Like restaurants, we tend to rely on fast food more so when traveling. Sometimes we couldn’t pass up on a quick dessert out after cooking in our Airbnbs on our trips.

Alcohol & bars ($370) expenses were down about 40% over last year. That’s great. It’s mostly just a matter of not having any very large and singular bar tabs. These costs mostly come from the occasional one or two drinks out, sampling regional beverages while traveling, and socializing with friends.
Travel
Just as 2021’s travel dramatically increased over 2020, this year’s travel took over our schedule. With that, our travel costs exploded.
Here are some of the bigger trips we completed in 2022:
- Winter escape to Puerto Rico
- Friend Birthday celebration in St. Augustine & Cape Canaveral, FL
- Spring adventure to Portugal (Lisbon, Cascais, Sintra, Porto) & Spain (Madrid)
- Chris’s Summer break in western/central Florida
- Summer volunteer trip to Peru
- Summer family beach trip to Emerald Isle, NC
- Chris’s adventure with friends to Spain & Italy (with a pitstop in Amsterdam to see Financial Mechanic!)
- Fall trip to NYC and Puerto Vallarta, MX
- Chris’s adventure with friends to the PNW (Washington, Oregon) and family in Phoenix, AZ
- Winter escape to Portugal (Terceira/Azores, Évora region, Lisbon)
- Winter cruise from Portugal to NYC
We stayed busy throughout the year!
In fact, with Chris having more time traveling between the two of us, he spent nearly half the year away from home. Naturally, our travel costs jumped to accommodate all the time spent away. But, this is an area we love to spend on!
Our hotel costs ($7,947) represent the largest chunk of our travel costs—about two-thirds of it. We’ve got to have somewhere to rest our weary legs at the end of the day. We cut this cost dramatically through the use of hotel certificates and travel rewards. We detail how in each of our monthly budget updates. Still, if you consider we spent about 180 days in hotel rooms…$8K isn’t too bad. That averages out to close to $50/night! And we didn’t feel like we were missing luxury nights!
Flight expenses ($4,057) came in about as expected, given how many trips we took. We didn’t have any particularly expensive flights; there were just quite a few of them! Our flights down to Peru for our volunteer trip were the most expensive. We cut the cost of several flights by flying ultra-low-cost carriers with a personal item only (a small backpack) or using airline miles where possible.
Rental car/taxi ($94) expenses dropped dramatically. This can be attributed to the abnormal rental costs abating and we just didn’t rent cars as often as last year.
We bumped out travel over last year as lockdowns ended. 2023 will certainly include plenty of travel, too. It’s hard to see how we could spend even more time abroad, but we’ll see! No doubt, these expenses will rise again!
Health & Fitness
Health insurance ($3,302) is no longer our highest single subcategory expense. This was made possible by our income dropping quite a bit throughout the year as we each continued on our plan to work only as much as we wanted to. Because of this, our ACA insurance rates dropped, which we both use. Confusingly, we expect next year’s cost will continue to go down as our income continues to drop.
Dental expenses ($259) were primarily for dental insurance.
Sports ($647) includes expenses for events like race registrations. It also includes membership to a rock climbing gym and fitness classes.

Doctor visit expenses ($706) consist of our copays for multiple visits to various specialty doctors.
Pharmacy costs ($625) represent mostly Jenni’s monthly generic medication-related costs and things like OTC medications and vaccines for each of us.
Eye care expenses ($71) were for new glasses for each of us and general eye care products.
Health & fitness, for the time being, is no longer the great expense category concern it once was. Even if the ACA is significantly castrated in the future, we’re getting more familiar with international care, DPC, and other solutions. We’ll see how this thought ages, though.
Bills & Utilities
Our utilities ($982) bill is about 80% for electricity. The remainder is a city-imposed wastewater fee. Other standard utilities (heating, water, trash, etc.) are covered by our HOA fee. As we were home less this year, this expense category decreased slightly.
Mobile phone ($285) expenses were for our two pre-paid SIM cards. We both have modern unlocked iPhones so we can use secondary cell provider services (MNVOs). MNVOs are much less expensive—and worth the effort—than the typical $50-70/month from AT&T or Verizon directly. Much of this year’s expense comes from willingly paying a somewhat high monthly bill for a short period to get a new iPhone 11 unlocked.
Internet service ($260) is provided by Comcast which has a near-monopoly in our area. The service is rarely down and not too expensive if you’re willing to call in to negotiate once a year, at least. We have a 300mbps connection.
Auto & Transport
These days, neither of us do much commuting.
The few days per week Jenni still works at the pharmacy, it’s a short 2-3 miles each way.
My work—on the increasingly rare days it happens—is all remote.
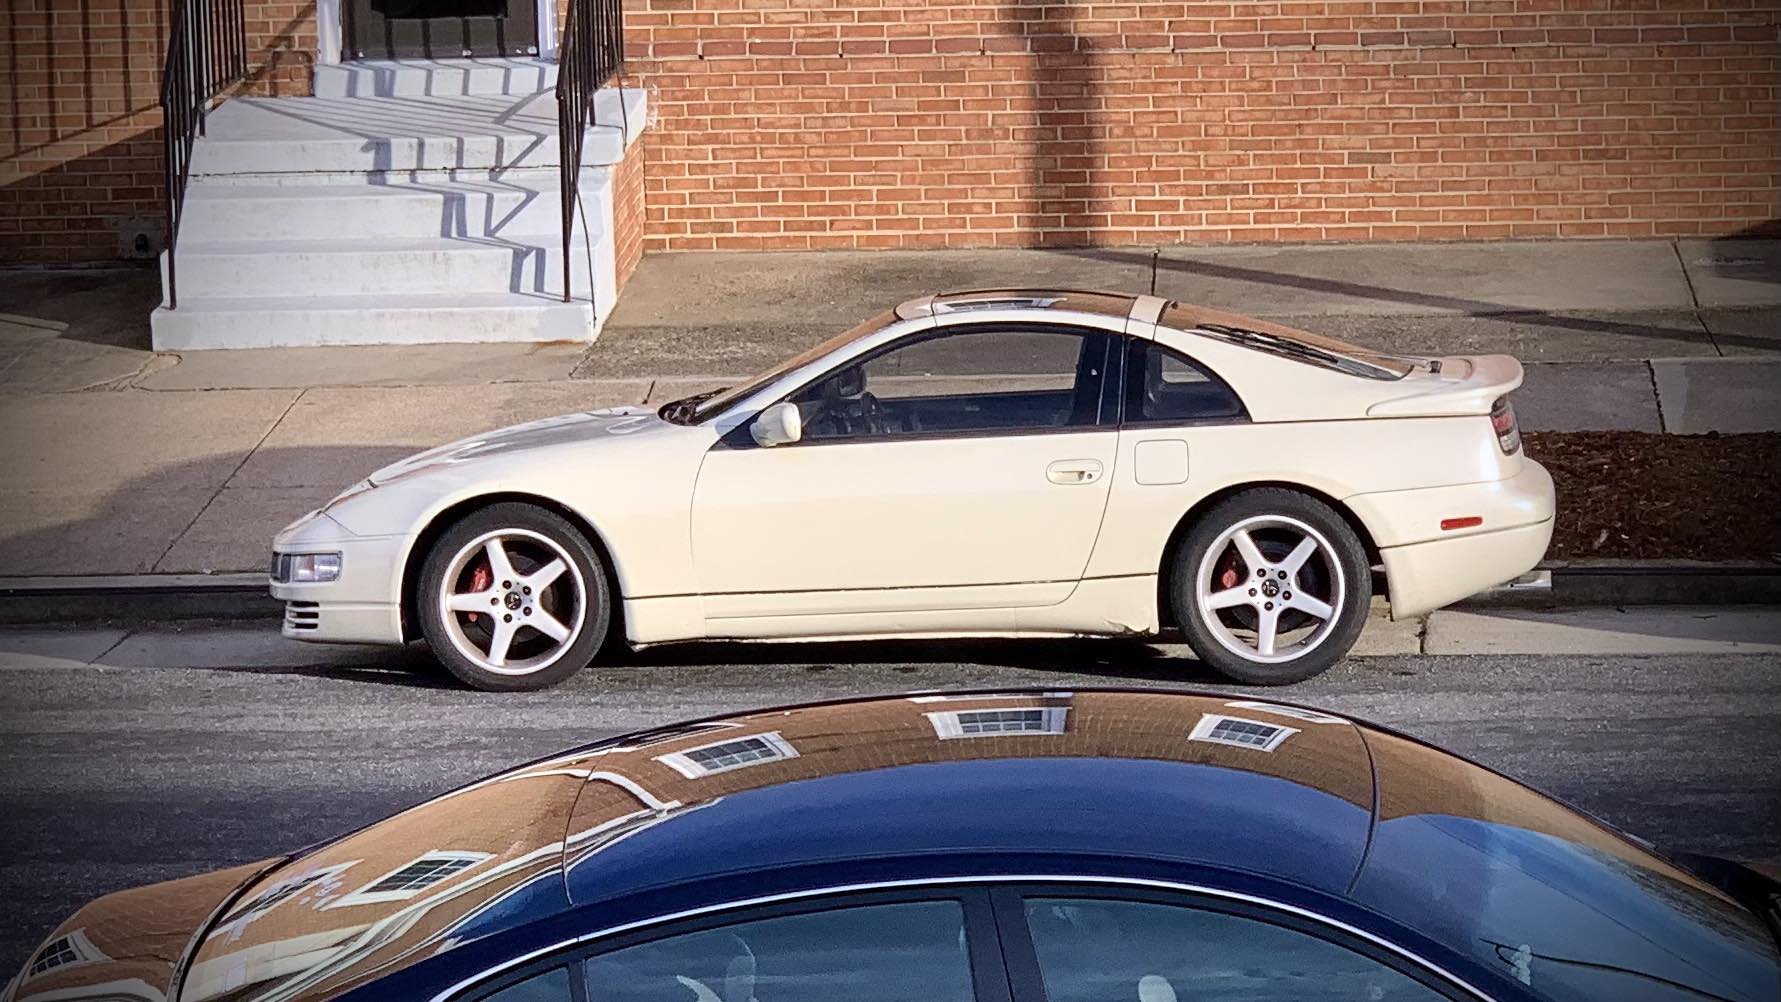
Our gas & fuel expenses ($953) come mostly from trips where we often rent a vehicle to tour the area. While we still own two vehicles, mine (a 1990 300ZX TT) sees less than 1,000 miles per year. We mostly use Jenni’s Prius which is very fuel efficient.
Auto insurance ($886) is provided by Geico. We get a shareholder discount by being shareholders of Berkshire Hathaway and a multi-line discount since our home insurance is through them as well. Our insurance is generally high deductible. This year, we boosted our coverage after a rash of catalytic converter thefts in our area (one which was half complete on Jenni’s Prius one night!).
Parking ($40) fees come mostly from airports and amusements we visited throughout the year.
Tolls ($140) are hard for us to avoid since we’re surrounded by toll roads where we live. The per-use fee is usually quite low (under a buck), so it’s often worth it to save time and avoid small local roads. We use an EZ Pass which is why the total is exactly $140 (the reload amount is $35).
Service & parts ($575) costs jumped as we had to repair the damage done to Jenni’s Prius catalytic converter. Otherwise, we did routine vehicle maintenance and inspection.
Property tax ($504) is for Jenni’s Prius. As my Nissan is an antique, it’s fortunately exempt from this ongoing tax. This expense’s jump, due to Jenni’s newer Prius purchase, was about 4x last year!
Public transportation ($316) expenses come from our use of various metros, subways, and trains throughout our travels. No surprise this grew dramatically as we traveled more.
Entertainment
2021 didn’t see the resurgence of TV & Movies or the Arts for us. Theaters weren’t yet a place we felt comfortable. That said…
Amusement ($838) saw a huge increase in spending. There were countless museums, parks, holiday events, and architectural wonders we visited throughout the year while traveling. We did kayak tours, train shows, big hikes, a Kennedy Space Center tour, and much more!
Shopping
Electronics & software ($-101) expenses are the wrong way to describe them. Ultimately, they were a little profit center for us! Despite making tons of small electronics upgrades (phones, watches, etc.), we came out ahead. We almost always buy this stuff used and keep our old items in great shape. So, we found buyers paying more for our old stuff than the great deals we got on new stuff. Not bad!
Clothing ($199) spending came from travel upgrades, which were mostly for Jenni this year. Quick drying pants, shirts, and so on.
Our sporting goods ($46) spending was attributed to a few small upgrades to raincoats, sports bras, jump rope, and a day pack. Pretty impressive.
Gifts & Donations
Gift giving ($217) reflects pretty typical holiday or birthday-related gift exchanges.
Despite our earnest attempts, we still routinely receive small holiday or birthday money from family members (I promise we’re not children!). We credit this spending category with those gift amounts, so our real gift spending is a few hundred bucks higher than the listed amount.
Direct charitable giving ($605) is up over last year. We focus on local organizations and helping those we know.
We’ve supported several local and national organizations with our giving and report most of it in our monthly budgets. The figure above does not include our DAF giving as part of our reader fund.
Personal Care
Our personal care expenses ($179) reflect restocking makeup, sunscreen, and other personal care products. We handle our own haircuts and grooming. A few massages during travel snuck into this expense, too. Worth it!
Fees & Charges
We use no-fee checking and savings accounts. Sometimes it’s worth bank service fees to receive signup promotions or other incentives.
Bank fees ($30) are incurred by Jenni’s HSA custodian which charges $2.50/month.
Major Unbudgeted Expenses
Occasionally, very large expenses pop up that is a once in a lifetime or decade event. A down payment on a house, an RV to go camping in, or a new car are good examples.
We had two of these this year.
Car Purchase
$1,000.
Jenni fell into a great opportunity. Her 2008 Prius, while still an excellent vehicle, became a local target for thieves. A good friend of ours happen to be selling their 2011 Prius at about this time. It had quite a few more miles on it, but he was offering us a sweetheart deal. On top of this, the newer Prius model was less targeted. Our total out-of-pocket cost after selling the old Prius was $1,000 to make the upgrade.
HOA Assessment
$1,850.
We’ve mentioned many times we live in a rather strange world of what was originally a 1920s-era cooperative. While it’s modernized to a pretty normal HOA, one thing we love about the cooperative underpinnings is that the small organization is internally run. Owners hold all the votes and operate board sets (at no cost).
We all get along, so it’s mostly just us as a group of neighbors trying to keep a very old building operating.
Relatedly, our shared garage building was in desperate need of garage door replacement. After the HOA kicked in its share, all owners were also assessed for $1,850. Hopefully, they’ll be good for another 100 years!
FIRE Budget Expense Tracking
Are you interested in tracking your spending as we do?
Since 2007, we’ve used Mint.com to track our credit and bank transactions. It’s where all the numbers in the expense table come from.
(Sadly, this service will be ending in 2024!)
Nearly all of our spending is done with rewards-generating credit cards which makes it easy to digitally track every penny spent (while also earning a bonus!).
We’ve made the original Google Spreadsheet available to the public if you’re interested in tracking your annual expenses as we do. You can even make your copy and add your data to it!
The spreadsheet is set up for tracking spending between two people, which is then added together. You could easily modify it to work with one person or a family of three or more.
You can also download a copy and use your favorite spreadsheet software like Excel or Numbers to make your edits locally.
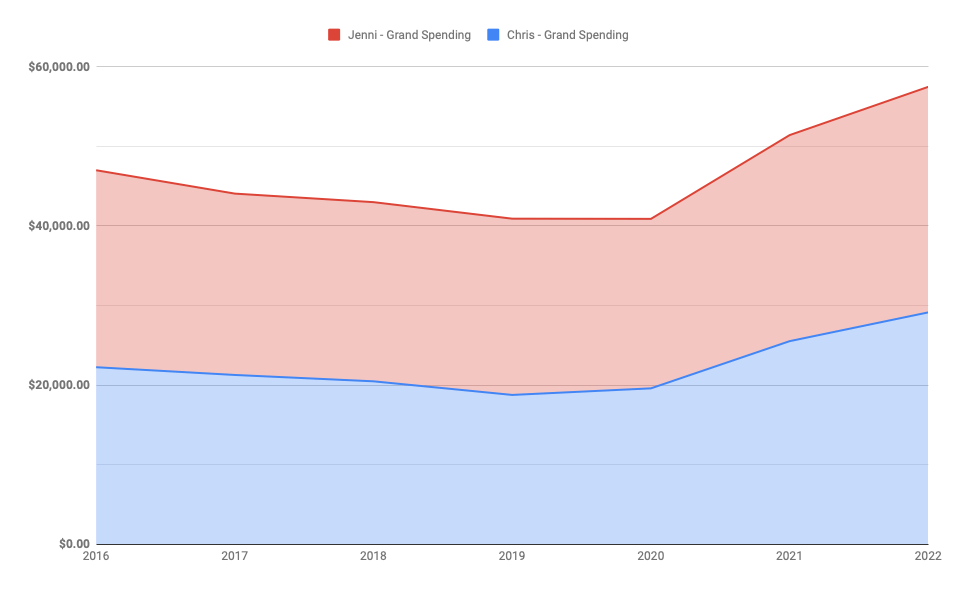
2016-2022 FIRE Budget
2022 began with the hope that the pandemic and lockdowns would continue to wane. It did and they have.
We took advantage and spent much of the year traveling and enjoying all the freedom that financial independence offers! Much of our budget is reflected in our travel.
Year-over-year comparison
2022 continued our lifestyle inflation. It’s not unexpected, especially as actual inflation is up significantly. We anticipated spending much more on travel this year. Our healthcare expenses dropped a lot.
Once we account for our inflation, our 2016 spending of $46,966 would be about $59,307 by January 2023 (source: BLS calculator). We came in about $2K under that, so, we’re still doing pretty good!
That said, we can’t continue to support too many ~12% year-over-year spending increases!
| Year | Total Spending ($) |
|---|---|
| 2016 | 46,966.17 |
| 2017 | 44,031.85 |
| 2018 | 42,958.89 |
| 2019 | 40,885.00 |
| 2020 | 40,861.66 |
| 2021 | 51,377.80 |
| 2022 | 57,438.56 |
By the middle of 2020 (and around the time we started TicTocLife), our budgeting goal was just to survive. If we could get out of this pandemic healthy and sane, I don’t think either of us would have batted an eye at a $50-60K budget.
We kept the numbers low in 2020. But, 2021-2022 have been years of release. We’ve been out traveling and experiencing the world we were shut from for a time. And it’s been well worth it.
Our running average since 2016 is $46,360 nominally.
Our 2022 FIRE Number
In general, we need 25 times our annual expenses in investments for us to pay those expenses (including taxes) from the growth of those investments. That reflects a Safe Withdrawal Rate (SWR) of 4%. We wrote a good bit more about this basic tenet in our FIRE introductory post.
Using this rule of thumb, we can calculate how much money we’d need to maintain our 2022 FIRE budget expenses moving forward.
| SWR (%) | Required Portfolio Value ($) |
|---|---|
| 4.0 | 1,435,964.00 |
If we worked from our December 2022 net worth update, our 2022 withdrawal rate would be around 3.1%. Compare that to 2020 which was 2.2% and 2021 which was 2.4%.
That’s a pretty significant jump. Our net worth took a hit along with the market and our spending increased.
But, we continue to earn a bit more money through work, though we’ve certainly long past the apex of our income. We’ll need to keep an eye on things, but we’re OK.
Our long-term goal is to continue to push extra income into more charitable pursuits like our reader fund. We know how much money is enough for us.
Future FIRE Budget
Our worries about healthcare costs, so far, haven’t proven to be valid. Our move to the ACA has drastically cut our costs as our income has fallen. While healthcare has been our most expensive category in recent years, that has changed.
Last year, we wrote:
Next year will see an even greater increase to our travel plans and a budget to match. A FIRE budget doesn’t have to be a restrictive strangle on fun.
And we certainly managed to do just that! Travel costs replaced healthcare as our most expensive FIRE budget item.
That feels pretty great. This whole financial freedom thing has come together for us to enjoy life in the way we’ve wanted to!
Do you know where to begin to join us? Your very own FIRE budget and plan for financial independence.
Let us know if you found some neat tips and tricks to achieving FIRE in our FIRE budget in the comments below!
4 replies on “FIRE Budget 2022: Our Life of Financial Freedom on $57,439”
Great breakdown. Thanks for sharing. Gotta love the numbers. The founder of Monarch was the former project manager of Mint. Do you plan on switching from Mint to Monarch?
Hey Christine!
We’re still working to find a good replacement for Mint. 🙁 So far, we’re combining Credit Karma with Rocket Money and Empower to get all the info we used to within Mint. Not a great solution. We’re hoping Piere eventually has a web interface as they’re working towards it.
Thanks for stopping by and we hope you continue to find some help in our annual data.
When we need 25x our expenses saved up to retire, that’s not an accurate representation to help you plan your future retirement date, is it? Since that would be assuming our expenses don’t go up with inflation. I suppose if you assume a 4% average rate of inflation per year, than I guess multiply your expenses times .04 for however many years you want to work. Then THAT number x 25 is your retirement investment goal, yes?
By the way I used to use mint as well! I’m a developer though so I’m developing my own software to use. Nice to keep something free when you have the skills for it, I hope you guys can find something free to replace it!
Hey Ernie!
Thanks for your comment and questions.
25x your annual expenses is a shortcut to defining your FIRE number and meeting the “4% rule”. You can find out more about that on our getting started with FIRE page.
The example on that page helps illuminate a little of your question:
There’s a section on how inflation and expected investment returns affect your longterm goals that will answer a lot of your questions, too. Be careful not to associate the the 4% rule as having to do with average inflation rates (which, do tend to be somewhat close to 4% longterm — closer to 3%, though). They’re unrelated. And yes, the 4% rule does account for your expenses going up with inflation.
We’re still working to find a good replacement for Mint. 🙁 So far, we’re combining Credit Karma with Rocket Money and Empower to get all the info we used to within Mint. Not a great solution. We’re hoping Piere eventually has a web interface as they’re working towards it.
Thanks again for stopping by!