
The tail-end of 2021 was like a coming-out party for us—finally, we could travel! And we really did. Our spending for the year ballooned by a whopping 26% to $51,378 over 2020! This post reveals how we got there.
Each year, Jenni and I break down our annual expenses in order to compare our current selves to our past—to see if we’re sticking with our spending trends over time. The expense data forms our annual budget basis.
As two 37-year-olds in a walkable area of Virginia, we feel like we have pretty typical modern lives with all the creature comforts one might desire. For years, our spending trended downward. But, a global pandemic may have been artificially keeping our costs low. And, we competed with 7.5% inflation over the year.
We hope revealing the details of our spending in this FIRE budget will inform your own spending goals. Perhaps it will lead you to a few tricks of how we keep our spending low and spend less than we earn.
While this post doesn’t include information on monthly income or net worth changes, our monthly budget updates do. Since May of 2020, we’ve detailed each monthly budget on TicTocLife. You can really dig into the numeric details of how we’ve reached FIRE through those budget reports.
Looking for newer info? Check out our 2022 summary.
Why annual spend review?
Jenni and I started tracking our combined expenses as a couple in 2016. By doing so, we can monitor for developing trends—if our combined restaurant expenses are on the rise, it might be indicative of a problem we need to address.
But, the data can also be reassuring.
For example, we both felt we were spending a lot more on groceries in 2020. It turned out we spent much less overall because we were able to save so much money through grocery rebates.
In 2021, we were worried how traveling for months of the year would blow up our budget—and it did—but perhaps not quite as much as we thought. It’s worth it to us.
We walk through all these categorical spending details below and hope that you find some diamonds in the rough to help build your own sustainable FIRE budget.
2021 FIRE Budget
Before we get into the nitty-gritty, let’s take a look at the 50,000-foot view of our FIRE budget in 2021.
We’ve produced a pie chart below that reveals the biggest spending categories for us.
With no surprise, our Home continues to be our most costly spending category. We’re happy to continue our 3.625% mortgage and relatively low maintenance.
But, what is surprising is just how close our second and third highest spending categories are. Health & Fitness costs—primarily health insurance—just edges out our Travel expenses for the year.
Combined, these three categories represent just over three quarters of our total spending!
Let’s see how that compares to similar pie charts from 2020 and 2019 below.
Wow! It’s evident that non-housing related costs are what ballooned for us in 2021 relative to previous years. Travel went from being roughly 4% of our spending in 2019 and 2020 to nearly 18%. That’s more than a four fold increase!
In fact that only spending category that saw a significant decrease was our Gifts—how embarrassing!
Let’s dive into the details.
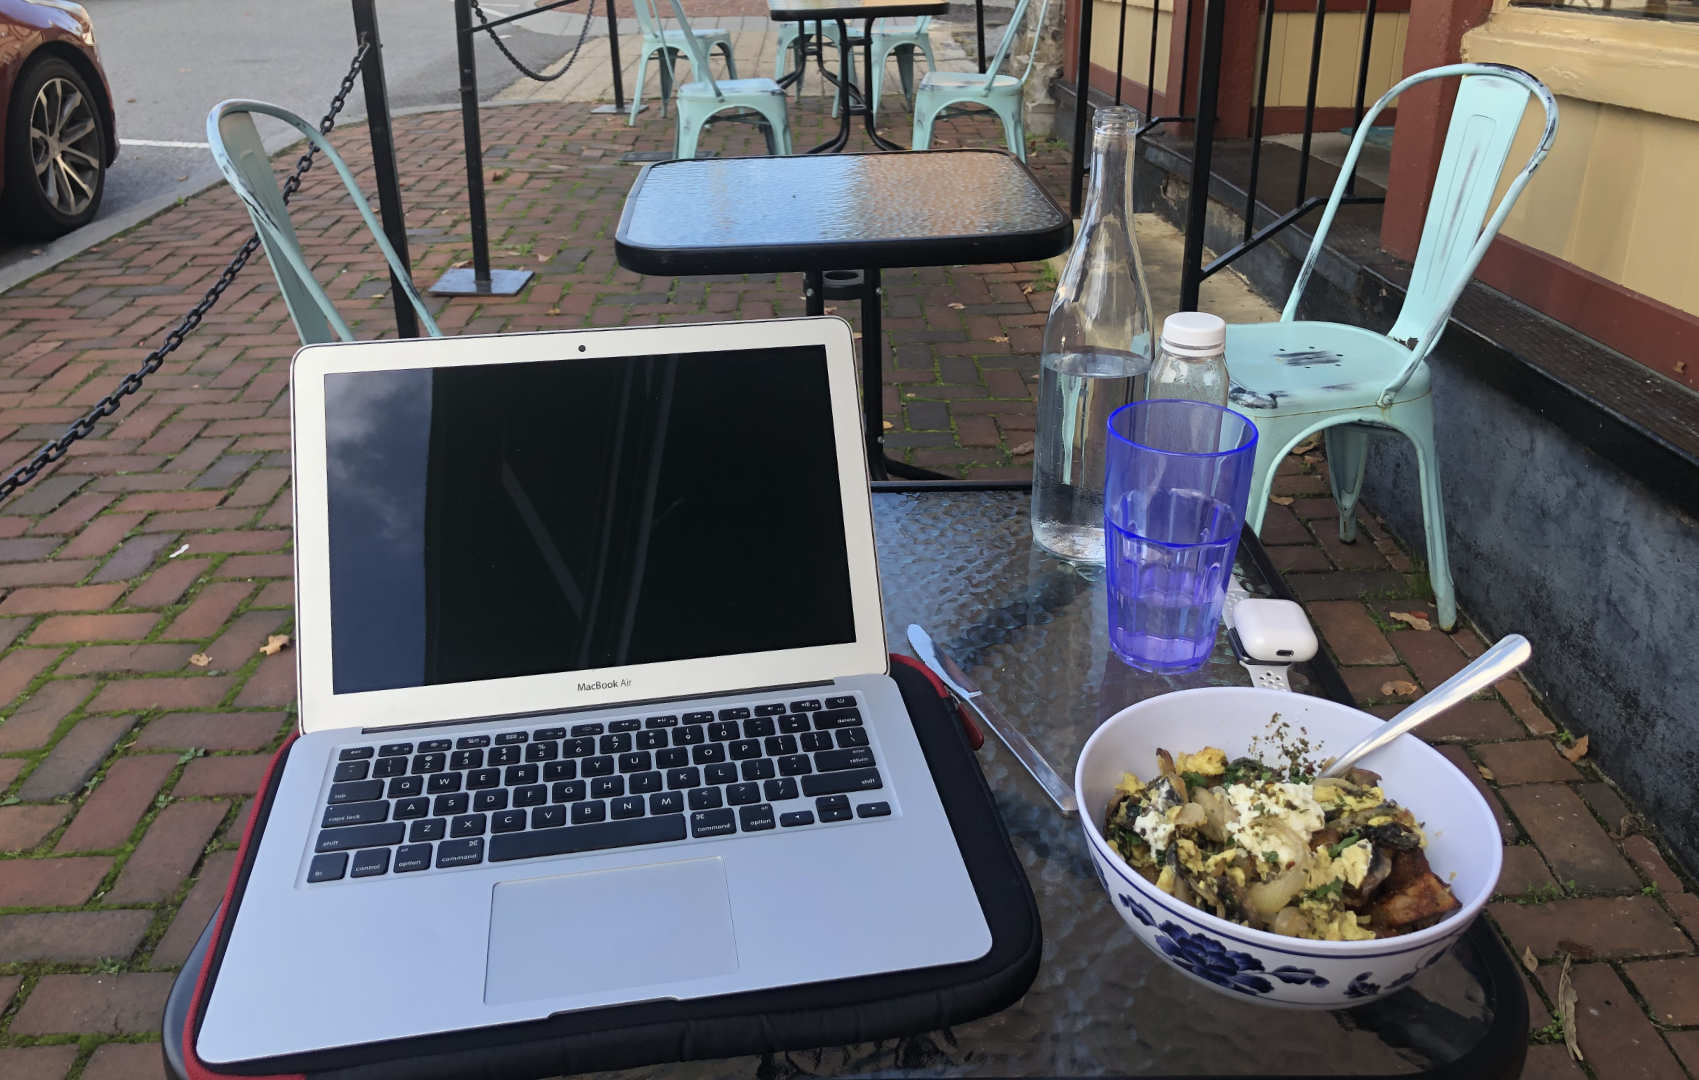
![Our return to travel meant that we were raining money on every [safe] opportunity we could find.](https://www.tictoclife.com/wp-content/uploads/2023/01/ttl-return-travel-fire-budget.jpg)
Expense details
Our categorized expense table below is grouped by parent categories (leftmost column), subcategories within that parent (middle column), and the amount spent (right column).
Parent categories are totaled on their row, summing all of the subcategory expenses below it.
Parent category names are linked to a short discussion about that category which follows the table.
As a point of reference, we live in a medium cost of living, medium-sized city in Virginia, in the United States.
We live on the edges of a city proper so we generally walk to entertainment, parks, and stores. Despite the higher taxes and living costs, we figured that free entertainment, easy walking, and reduced commuting made city life a better choice for us than country living.
Categorized expense table
| Category | Subcategory | Spent ($) |
|---|---|---|
| Home | 21,278.55 | |
| Mortgage Principal | 4,552.43 | |
| Mortgage Interest | 5,495.41 | |
| Property Tax | 3,516.00 | |
| Insurance | 790.00 | |
| Improvement | 1,152.00 | |
| Service | 1,152.00 | |
| HOA Fees | 4,200.00 | |
| Lawn & Garden | 30.99 | |
| Supplies | 106.37 | |
| Furnishings | 283.35 | |
| Food & Dining | 5,627.81 | |
| Groceries | 3,260.52 | |
| Restaurants | 1,583.97 | |
| Fast Food | 131.06 | |
| Alcohol & Bars | 592.19 | |
| Coffee Shops | 60.07 | |
| Travel | 8,978.75 | |
| Hotel | 5,452.16 | |
| General | 0.00 | |
| Air Travel | 1,624.25 | |
| Rental Car/Taxi | 1,902.34 | |
| Health & Fitness | 10,216.33 | |
| Insurance | 7,466.52 | |
| Dentist | 411.88 | |
| Sports | 551.88 | |
| Doctor | 993.08 | |
| Pharmacy | 410.86 | |
| Eyecare | 382.11 | |
| Bills & Utilities | 1,619.03 | |
| Utilities | 1,016.46 | |
| Mobile Phone | 131.40 | |
| Internet | 471.17 | |
| Auto & Transport | 1,922.99 | |
| Gas & Fuel | 764.68 | |
| Insurance | 585.92 | |
| Parking | 124.63 | |
| Tolls | 140.00 | |
| Service & Parts | 116.05 | |
| Property Tax | 128.76 | |
| Public Transportation | 62.95 | |
| Entertainment | 758.36 | |
| TV & Movies | 0.00 | |
| Amusement | 758.36 | |
| Arts | 0.00 | |
| Shopping | 528.76 | |
| Electronics & Software | 57.92 | |
| Clothing | 75.68 | |
| Books | 0.00 | |
| Sporting Goods | 395.16 | |
| Toys & Hobbies | 0.00 | |
| Gifts & Donations | 301.07 | |
| Gift | 96.89 | |
| Charity | 204.18 | |
| Personal Care | 76.15 | |
| General | 76.15 | |
| Laundry | 0.00 | |
| Fees & Charges | 70.00 | |
| Bank Fees | 70.00 | |
| Service Fees | 0.00 | |
| Major Unbudgeted Expenses1 | ||
| Car purchase, cosmetic surgery, yacht, etc. | 0.00 | |
| Subtotal2 | 41,329.96 | |
| GRAND TOTAL | 51,377.80 | |
| 4% SWR Basis3 | 1,284,445.00 | |
(1): Large, unplanned and unbudgeted expenses can come up but should be infrequent.
(2): Defined as all expenses minus mortgage interest & principal—if we paid the mortgage off this is what we’d have spent.
(3): In order to maintain this level spending, we’d need this much in appreciating assets to meet the classic “4% rule” (25x our annual expenses, the Grand Total number)
FIRE budget breakdown
We think that the expense numbers really only tell half the story. For each spending category, we explain what expenses we incurred, why, and some spending strategies to help you manage your own costs.
If you’re uninterested in the details, skip down to our overall review of our 2021 expenses.
Home
The Home budget category covers all things related to our housing. Our home purchase in 2013 included a 20% downpayment and a 30-year fixed rate APR mortgage near 3.8%.
Total mortgage principal & interest: $10,048.
Unfortunately, 2021 came with the surprise that despite analyzing our refinancing prospects—and determining it was worthwhile—we were rejected!
Our property taxes ($3,516) remained even despite the market continuing its march upward, locally.
Our home insurance ($790) is through Geico and didn’t budge. Our coverage is enough to cover replacement costs and has a high deductible scheme. We earn a slight discount on our home insurance by being shareholders of Berkshire Hathaway (and therein, Geico).
Home improvement and services ($2,304) are budgeted as 1% of the value of the dwelling (so 0.5% per). According to the FIRE budget above, we anticipate $96 per month for both improvement and service categories. So, $192/month over 12 months means a total of $2,304 per year, equating to a $230,040 dwelling.
In 2023, it may be time to reevaluate this figure and increase how much we set aside for maintenance and improvement as the home continues to age and values increase.
When folks evaluate whether to rent and invest or buy a home, some total homeownership costs are often overlooked—like ongoing repair and maintenance.
Our real maintenance & improvement expenses this year were $954. That covered a lot!
- A never-ending leaky roof (that ended)
- Window sash cord replacement (and cellular shades)
- Bathroom exhaust fan
- A little paint and more
Setting aside 1% of the value of the home each year has helped us smooth out the lumpy costs of maintaining a home.
The HOA fee ($4,200) may seem high at first glance, but the fee covers multiple utility-like expenses. The fee includes:
- Heating
- Water usage
- Landscaping
- Common area maintenance
- Garage maintenance
- Gutter cleaning
Our HOA is managed internally by fellow owners, unpaid. Fees end up flowing back to owners—and often in more collective, efficient ways. For example, a single commercial water boiler provides hot water for everyone. Our neighborhood was originally set up as a cooperative in the 1920s.
Home supplies ($106) include cleaning items, water filters, and so on.
Furnishings ($283) covered the net cost (after selling our old pieces) of:
- A beautiful, massive New Zealand white shag wool rug
- 4-pc Italian white bedroom dresser set
- Jenni’s complete reupholstering of 6-pc mid-century modern dining chairs
- A modern, motorized standing desk
Food & Dining
Our grocery expenses ($3,261) were dramatically less than in 2019, but only because of multiple major credit card rewards benefits. As mentioned last year, Chase’s ability to payback grocery expenses with points was very valuable to us. In fact, we cut about $2,479 off our grocery expenses this way!
![Our typical meal at home includes a variety of veggies and mix of carbs with a bit of [occasional] seafood.](https://www.tictoclife.com/wp-content/uploads/2023/01/ttl-typical-meal.jpg)
As I mentioned in our 2020 FIRE Budget, we didn’t spend as much time in-store shopping deals due to the pandemic. That’ll likely change in 2022.
We do our best to abide by the principles outlined in our expert how to save money on groceries post.
Restaurant spending ($1,584) doubled our 2020 levels. Still, at a little over $100/month, it wasn’t too bad given the context of significantly more travel. It’s hard to always avoid costly and convenient restaurants while away from home. In addition, sometimes we cover a restaurant trip with friends to say thanks or in exchange for them covering some other expense.

Our fast-food budget ($131) was comprised almost entirely of pickup orders via DoorDash, Grubhub, or Uber Eats. Our various credit cards offer credits towards these services which encouraged our use but meant that we’d often have a small balance to cover out of pocket. Still, it’s been worthwhile and has helped keep our restaurant spending down.
Alcohol & bars ($592) expenses grew over that of last year, which was already a little higher than expected. This is explained by the fact that there was just more places to catch a drink which were open this year. While traveling, we’d happily stop in for the occasional pint to soak in the views and culture of an area.

Travel
Unlike 2020, this year included several trips for us as the global pandemic began to ease. Naturally, our travel-related expenses exploded compared to last year.
Here are some of the bigger trips we completed over 2021:
- Beach trip to Emerald Isle, NC with friends
- Rock climbing adventure to Fayetteville, WV with friends
- Coastal beach trip to Amelia Island, FL and Jekyll Island, GA
- A multi-day tour of Door County, WI with old friends
- Beach escape to Marco Island, FL with friends
- Hiking adventure through Flagstaff, Sedona, and the Grand Canyon in AZ
- Visit friends, family, and more hiking in the LA area
- Chris’s bike adventure and friends visit in SWVA
- Chris’s home improvement education from Mr. 1500 in Colorado and beach trip to Florida
- Family visit to northern Florida
- Thanksgiving family trip to Michigan
- Escape from the cold to the Florida Keys
- Family Christmas in Williamsburg, VA
Yep, it was a lot!
We probably spent about a quarter of the year away from home. Naturally, that means our hotel and other travel-related costs skyrocketed. Expenses we were happy to experience!
Our hotel costs ($5,452) were the core reason for our massive travel expense. While we did stay at a few nicer hotels, those were mostly covered by points or free hotel night certificates. The high expense here is mostly an effect of just being away from home for so many days. If we’d spent a quarter of the year away from home in hotels, even at $100/night, that’d be about $9,000! With that consideration, we didn’t do too bad.


Flight expenses ($1,624) came in a little lower than we’d expected. We had dozens of flights over the year. But, many were with ultra low cost carriers like Frontier or Spirit where a flight was frequently around $40. Managing with a single personal item and no checked luggage (yes, even on multi-week hiking adventures) really helped keep our flight costs low. Multiple flights were covered by reward miles/points, too.

Rental car/taxi ($1,902) being so high is a reflection of where we were traveling to. Most of our trips were within the US in 2021, which is already a car traveling country. On top of that, we were often in non-urban areas without public transit so we ended up with a lot of rental cars. You might recall the rental car shortages throughout the year which also meant elevated prices for our rentals. Still, for how many days we had a rental car, this expense isn’t too horrendous.
As the world began climbing out of the global pandemic, our travel frequency exploded towards the end of 2021. Next year, the trend will likely continue but with an international flavor. No doubt, these expenses will rise again!
Health & Fitness
Health insurance ($7,467) remains our highest single expense subcategory. It was more than the interest we paid on our mortgage or our hotel expenses that ballooned this year.
Jenni switched to an ACA plan in 2021, which looked good on paper. But, a sudden influx of dividends right at the end of the year nullified any reduced cost for her plan as her income suddenly peaked. That loss cost her about $1,200 in increased insurance cost and represented our biggest financial mistake of the year.
I remain on a grandfathered (pre-ACA) high deductible health plan (HDHP) that is HSA eligible. If you’re not already invested in an HSA—consider it. If you’re not sure how they work or have questions, check out Jenni’s top HSA questions and answers post. I’ll switch to an ACA plan for 2022 as my income continues to dwindle.
Dental expenses ($412) were primarily for dental insurance.
Sports ($552) includes expenses for events like race registrations. It also includes membership to a rock climbing gym and fitness classes.
Doctor visit expenses ($993) consists of Jenni’s copays for multiple visits to various specialty doctors and an allergy test.
Pharmacy costs ($411) represent mostly Jenni’s monthly generic medication-related costs and things like OTC medications and vaccines for each of us.
Eye care expenses ($382) were for a few new pairs of glasses for Jenni and eye-related care like contact solution. Chris also had a routine exam and evaluation to update his prescription.
Our health care costs will almost certainly continue to rise. Not only are we getting older, but healthcare costs in the US are easily outpacing inflation. With both of us off employer-provided health insurance, we have to incur all health-related expenses ourselves.
It’s possible that we may experiment with medical tourism or other alternative healthcare routes like direct primary care (DPC) in the future.
Health & fitness remains our single most concerning expense category.
Bills & Utilities
Our utilities ($1,016) bill is about 80% for electricity. The remainder is a city-imposed wastewater fee. Other standard utilities (heating, water, trash, etc.) are covered by our HOA fee. As we were home less this year, this expense category actually decreased slightly.
Mobile phone ($131) expenses were for our two pre-paid SIM cards. We both have modern unlocked iPhones so we can use secondary cell provider services.
I paid about $96 for 1 year of service from Boost Mobile with 2GB data/month. Jenni paid $30/month for 6 months of Cricket service in order to get a free iPhone SE 2nd Generation. Once it was unlocked, she shifted to a less expensive provider and kept the new phone. A variety of credit card offers offset much of our costs.
MNVOs are much less expensive—and worth the effort—than the typical $50-70/month from AT&T or Verizon directly.
Internet service ($471) is provided by Comcast which has a near-monopoly in our area. The service is rarely down and not too expensive if you’re willing to call in to negotiate once a year, at least. We have a 120mbps connection.
Auto & Transport
These days, neither of us really do much commuting.
The few days per week Jenni still works at the pharmacy, it’s a short 2-3 miles each way.
My work—on the increasingly rare days it happens—is all remote.
Our gas & fuel expenses ($765) come mostly from trips where we often rent a vehicle to tour the area. While we still own two vehicles, mine (a 1990 300ZX TT) sees less than 1,000 miles per year. We mostly use Jenni’s Prius which is very fuel efficient.
Auto insurance ($586) is provided by Geico. We get a shareholder discount by being shareholders of Berkshire Hathaway and a multi-line discount since our home insurance is through them as well. Our insurance is generally high deductible.
Parking ($125) fees come mostly from parks and amusements we visited throughout the year.
Tolls ($140) are hard for us to avoid since we’re surrounded by toll roads where we live. The per use fee is usually quite low (under a buck), so it’s often worth it to save time and avoid small local roads. We use an EZ Pass which is why the total is exactly $140 (the reload amount is $35).
Service & parts ($116) were pretty low for the year with just routine oil changes and inspection.
Property tax ($129) is for Jenni’s Prius. As my Nissan is an antique, it’s fortunately exempt from this ongoing tax.
Public transportation ($63) expenses come from our use of various metros, subways, and trains throughout our travels.
Entertainment
2021 didn’t see the resurgence of TV & Movies or the Arts for us. Theaters weren’t yet a place we felt comfortable. That said…
Amusement ($758) saw a huge increase in spending. There were countless museums, parks, holiday events, and architectural wonders we visited throughout the year.

Shopping
Electronics & software ($58) came out quite low despite plenty of small upgrades. There was lots of small things. A phone tripod, portable battery, two sets of earbuds, a Wi-Fi card for Jenni’s computer, and a mouse pad. And, there were big things. A used 2015 MacBook Air and desktop computer innards upgrade for Chris. But, those were all offset by either Chris’s business paying for them or our local sales of the old items they replaced.
Clothing ($76) spending came from Jenni making a few upgrades to her wardrobe.
Our sporting goods ($395) spending was attributed to a variety of upgrades or necessary purchases to support new hobbies like rock climbing. A water camel pack, bike brake replacement, running hat, climbing harness, gear, & shoes, bathing suits, and a foot brace were all in the mix.
Gifts & Donations
Gift giving ($97) reflects pretty typical holiday or birthday-related gift exchanges.
Despite our earnest attempts, we still routinely receive small holiday or birthday money from family members (I promise we’re not children!). We credit this spending category with those gift amounts, so our real gift spending is a few hundred bucks higher than the listed amount.
Direct charitable giving ($204) was a little lower this year as we focused on our DAF giving. Still, Jenni took on local support of a family for Christmas.
We’ve supported several local and national organizations with our giving and report most of it in our monthly budgets. The figure above does not include our DAF giving as part of our reader fund.
Personal Care
Our personal care expenses ($76) reflect restocking makeup, sunscreen, and other personal care products. We handle our own haircuts and grooming.
Fees & Charges
We use no-fee checking and savings accounts. Sometimes it’s worth bank service fees to receive signup promotions or other incentives.
Bank fees ($70) were triggered while adjusting some of our investments for a few dozen dollars. While below a minimum threshold, our HSA custodian charges $2.50/month.
Major Unbudgeted Expenses
Occasionally, very large expenses pop-up that is a once in a lifetime or decade event. A down payment on a house, an RV to go camping in, or a new car are good examples.
We had no major unbudgeted expenses this year.
FIRE Budget Expense Tracking
Are you interested in tracking your spending as we do?
Since 2007, we’ve used Mint.com to track our credit and bank transactions. It’s where all the numbers in the expense table come from.
Nearly all of our spending is done with rewards-generating credit cards which makes it easy to digitally track every penny spent (while also earning a bonus!).
We’ve made the original Google Spreadsheet available to the public if you’re interested in tracking your annual expenses as we do. You can even make your own copy and add your own data to it!
The spreadsheet is set up for tracking spending between two people, which is then added together. You could easily modify it to work with one person or a family of three or more.
You can also download a copy and use your favorite spreadsheet software like Excel or Numbers to make your edits locally.
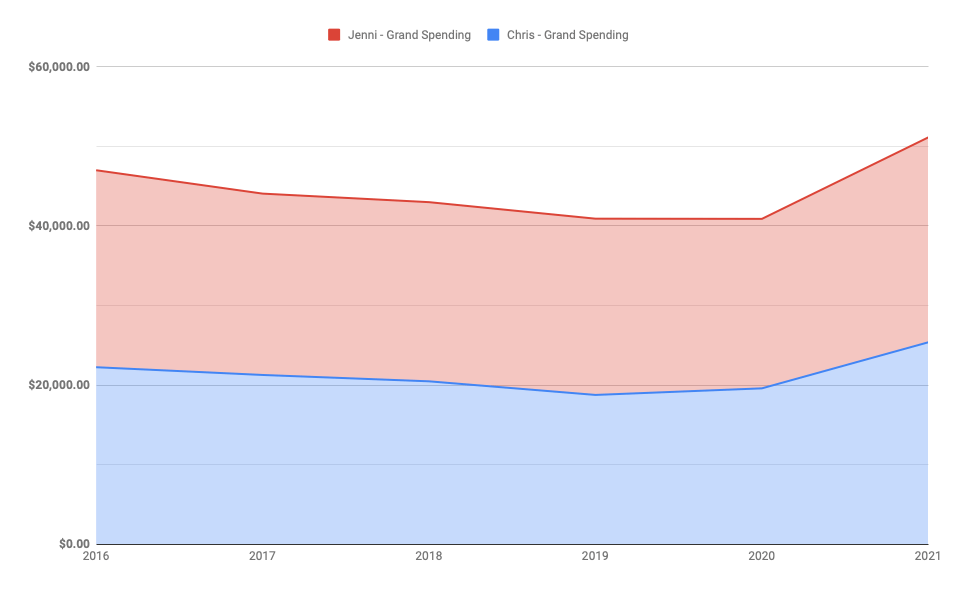
2016-2021 FIRE Budget
2021 began with a global pandemic still roiling our plans—but worse than that—it was still ripping families apart and wreaking havoc around the globe.
It wasn’t until later in 2021 that we began to find some mental relief and capacity to travel and enjoy the world as our early retirement originally intended. And, with that, our budget ballooned pretty quickly.
But, that’s what we always intended. Nothing like a catastrophe to push you to get out and do what you’ve left for your future, today—as soon as you can.
Year-over-year comparison
2021 broke our streak of maintaining or beating our 2016 level of nominal spending. However, once we account for our inflation, our 2016 spending of $46,966 would be about $54,785 by January, 2022. We came in about $3K under that, so, we’re still doing pretty good!
That said, we can’t continue to support too many ~26% year-over-year spending increases!
| Year | Total Spending ($) |
|---|---|
| 2016 | 46,966.17 |
| 2017 | 44,031.85 |
| 2018 | 42,958.89 |
| 2019 | 40,885.00 |
| 2020 | 40,861.66 |
| 2021 | 51,377.80 |
By the middle of 2020 (and around the time we started TicTocLife), our budgeting goal was really to just survive. If we could get out of this pandemic healthy and sane, I don’t think either of us would have batted an eye at a $50-60K budget.
We kept the numbers low in 2020, but 2021 shows us what can happen to our budget when we really start to let loose. 2022 will likely be more of the same before we can reevaluate what’s important to us as the pandemic (hopefully) fades into the background.
Our running average since 2016 is $44,514 nominally.
Our 2021 FIRE Number
In general, we need 25 times our annual expenses in investments in order for us to pay those expenses (including taxes) from the growth of those investments. That reflects a Safe Withdrawal Rate (SWR) of 4%. We wrote a good bit more about this basic tenet in our FIRE introductory post.
Using this rule of thumb, we can calculate how much money we’d need to maintain our 2021 FIRE budget expenses moving forward.
| SWR (%) | Required Portfolio Value ($) |
|---|---|
| 4.0 | 1,284,445.00 |
If we worked from our December 2021 net worth update, our 2021 withdrawal rate would be around 2.4%. Compare that to 2020 which was 2.2%.
In the grand scheme of things, our spending increases in 2021 still leave a ton of wiggle room.
Additionally, we’ll continue to earn a bit more money through work, though we’ve certainly long past the apex of our income.
Jenni is still doing some part-time work at the pharmacy.
I have one remaining digital strategy client that takes up a day or two of work each month.
Our long-term goal is to continue to push extra income into more charitable pursuits like our reader fund. We know how much money is enough for us.
Future FIRE Budget
Just as in 2021, our most important FIRE budget-related expense to keep an eye on is our healthcare costs. Insurance expenses continue to rise and we have no reason to expect that our healthcare costs won’t also increase.
Next year will see both of us using the ACA Healthcare.gov Marketplace for health insurance. We began that experiment this year, but it backfired when our income rose. We’ll be more diligent with this moving forward.
Last year, I wrote:
While we’ve always vaguely planned to spend somewhere between three and six months of the year abroad once we both drastically cut back on work, we’re really champing at the bit now to get out and see the world. Cost probably won’t be as big of a concern as access and safety for the foreseeable future.
That proved to be true in 2021. We spent about a quarter of the year away from home on different adventures and traveling. We mostly stuck to the US to help reduce our health-related risk.
Next year will see an even greater increase to our travel plans and a budget to match.
A FIRE budget doesn’t have to be a restrictive strangle on fun.
But a FIRE budget, even if it’s just a thorough annual spending review and discussion like ours, should be part of your plan for financial independence.
Let us know if you found some neat tips and tricks to achieving FIRE in our FIRE budget in the comments below!
3 replies on “Annual Spend Summary 2021: $51,378 and Where It Went”
It seems this post is about a year late.
Haha, you’ve got it! Yeah, 2022 (spoiler alert) was spent traveling and we really struggled to keep up posting.
That said, I think we might manage to have 2022’s FIRE budget out much faster!
Thanks for coming by!
Looking forward to it.