With summer’s end comes an end to our series of adventures and trips out of the country. We spent September at home catching up with friends, completing our task lists, and working off plenty of European calories. Still, we managed to have some financial fun with surprise home repair headaches!
For our monthly donation, our theme is clean water. You can read more about the three charities we’re considering and vote for your favorite in the poll below!
We track our income, spending, and savings each month to stay on our FIRE path and share it with you. Keep reading to see our monthly updates, tips, and charity reviews.
Budget Update
In the Sankey diagram below, the income on the left matches our expenses on the right.

We’ll run through the income and expense sources for the month and remark on any interesting items.
Income Summary
Our income was pretty mixed this month, with investments and business-related income pretty high.
Investments
More frequently, we have to make ends meet by selling our existing investments. Our small ongoing incomes and dividends don’t always meet our needs. Of course, this is part of the FIRE plan. This month’s investment sales refill our checking accounts and help offset some future expenses we are anticipating.
Jenni sold $3,521 of stock shares.
Dividends
Our dividends are keeping us afloat lately! We anticipate significant dividend payments from our various stock holdings—most of them from Vanguard funds like VTSAX. More than half of our distributions were automatically reinvested in our tax-advantaged accounts.
We earned $4,130 in total distributions.
Accountable Plan
If you’re interested in the details of how an accountable plan for businesses works, check out this original post.
Chris’s business reimbursed him for the use of our house, utilities, health insurance, and other expenses. This reimbursement covers expenses for the third quarter of 2025.
Chris received $1,514 in reimbursements.
Credits
Our big “credits” push this month was a reimbursement from Jenni’s health insurance provider for about $116. This reimbursement is inconsistent and often appears at the end of the year. Presumably, they’ve not seen the utilization level that is estimated and partially reimburse premiums as some part of the ACA regulations.
We received $126 in credits.
Our total income for the month came to $11,362.24.
Expense Summary
From our $11,362 monthly budget, we saved and invested $7,325 dollars.
After subtracting our credits, savings, and donations—we spent about $3,911 on living expenses.
That’s 82% of our FIRE budget from 2022 ($4,787/month).
Let’s break down some of the more exciting details this month.
Food & Dining
Being home for the month, our food expenses dropped a good bit. We didn’t dine out much—just a few fast food stops here and there. And, a lot of our grocery shopping involved special app pickup deals or other coupon-like things.

Groceries
We managed to really stock up on pantry goodies this month. Sauces, flavorings, and other shelf-stable stuff will last us for months—if not until next year! With some local closeouts, we occasionally paid around 10-20% of the sticker price on these goods. Awesome!
Restaurants, Fast food, Alcohol & bars
Our neighborhood runs an Oktoberfest event (yes, in September) that we enjoy strolling. Chris couldn’t resist the massive Bavarian-style pretzels and picked one up. On a separate occasion, Jenni met with a friend for lunch out. We ate a lot at home this month!
We spent $395 on food & dining this month.
Home
Our typical home expenses (mortgage, HOA, insurance) were unchanged this month. But we had a big spike in home repair/improvement/service costs. We had a couple of projects, in fact!
Home Improvement
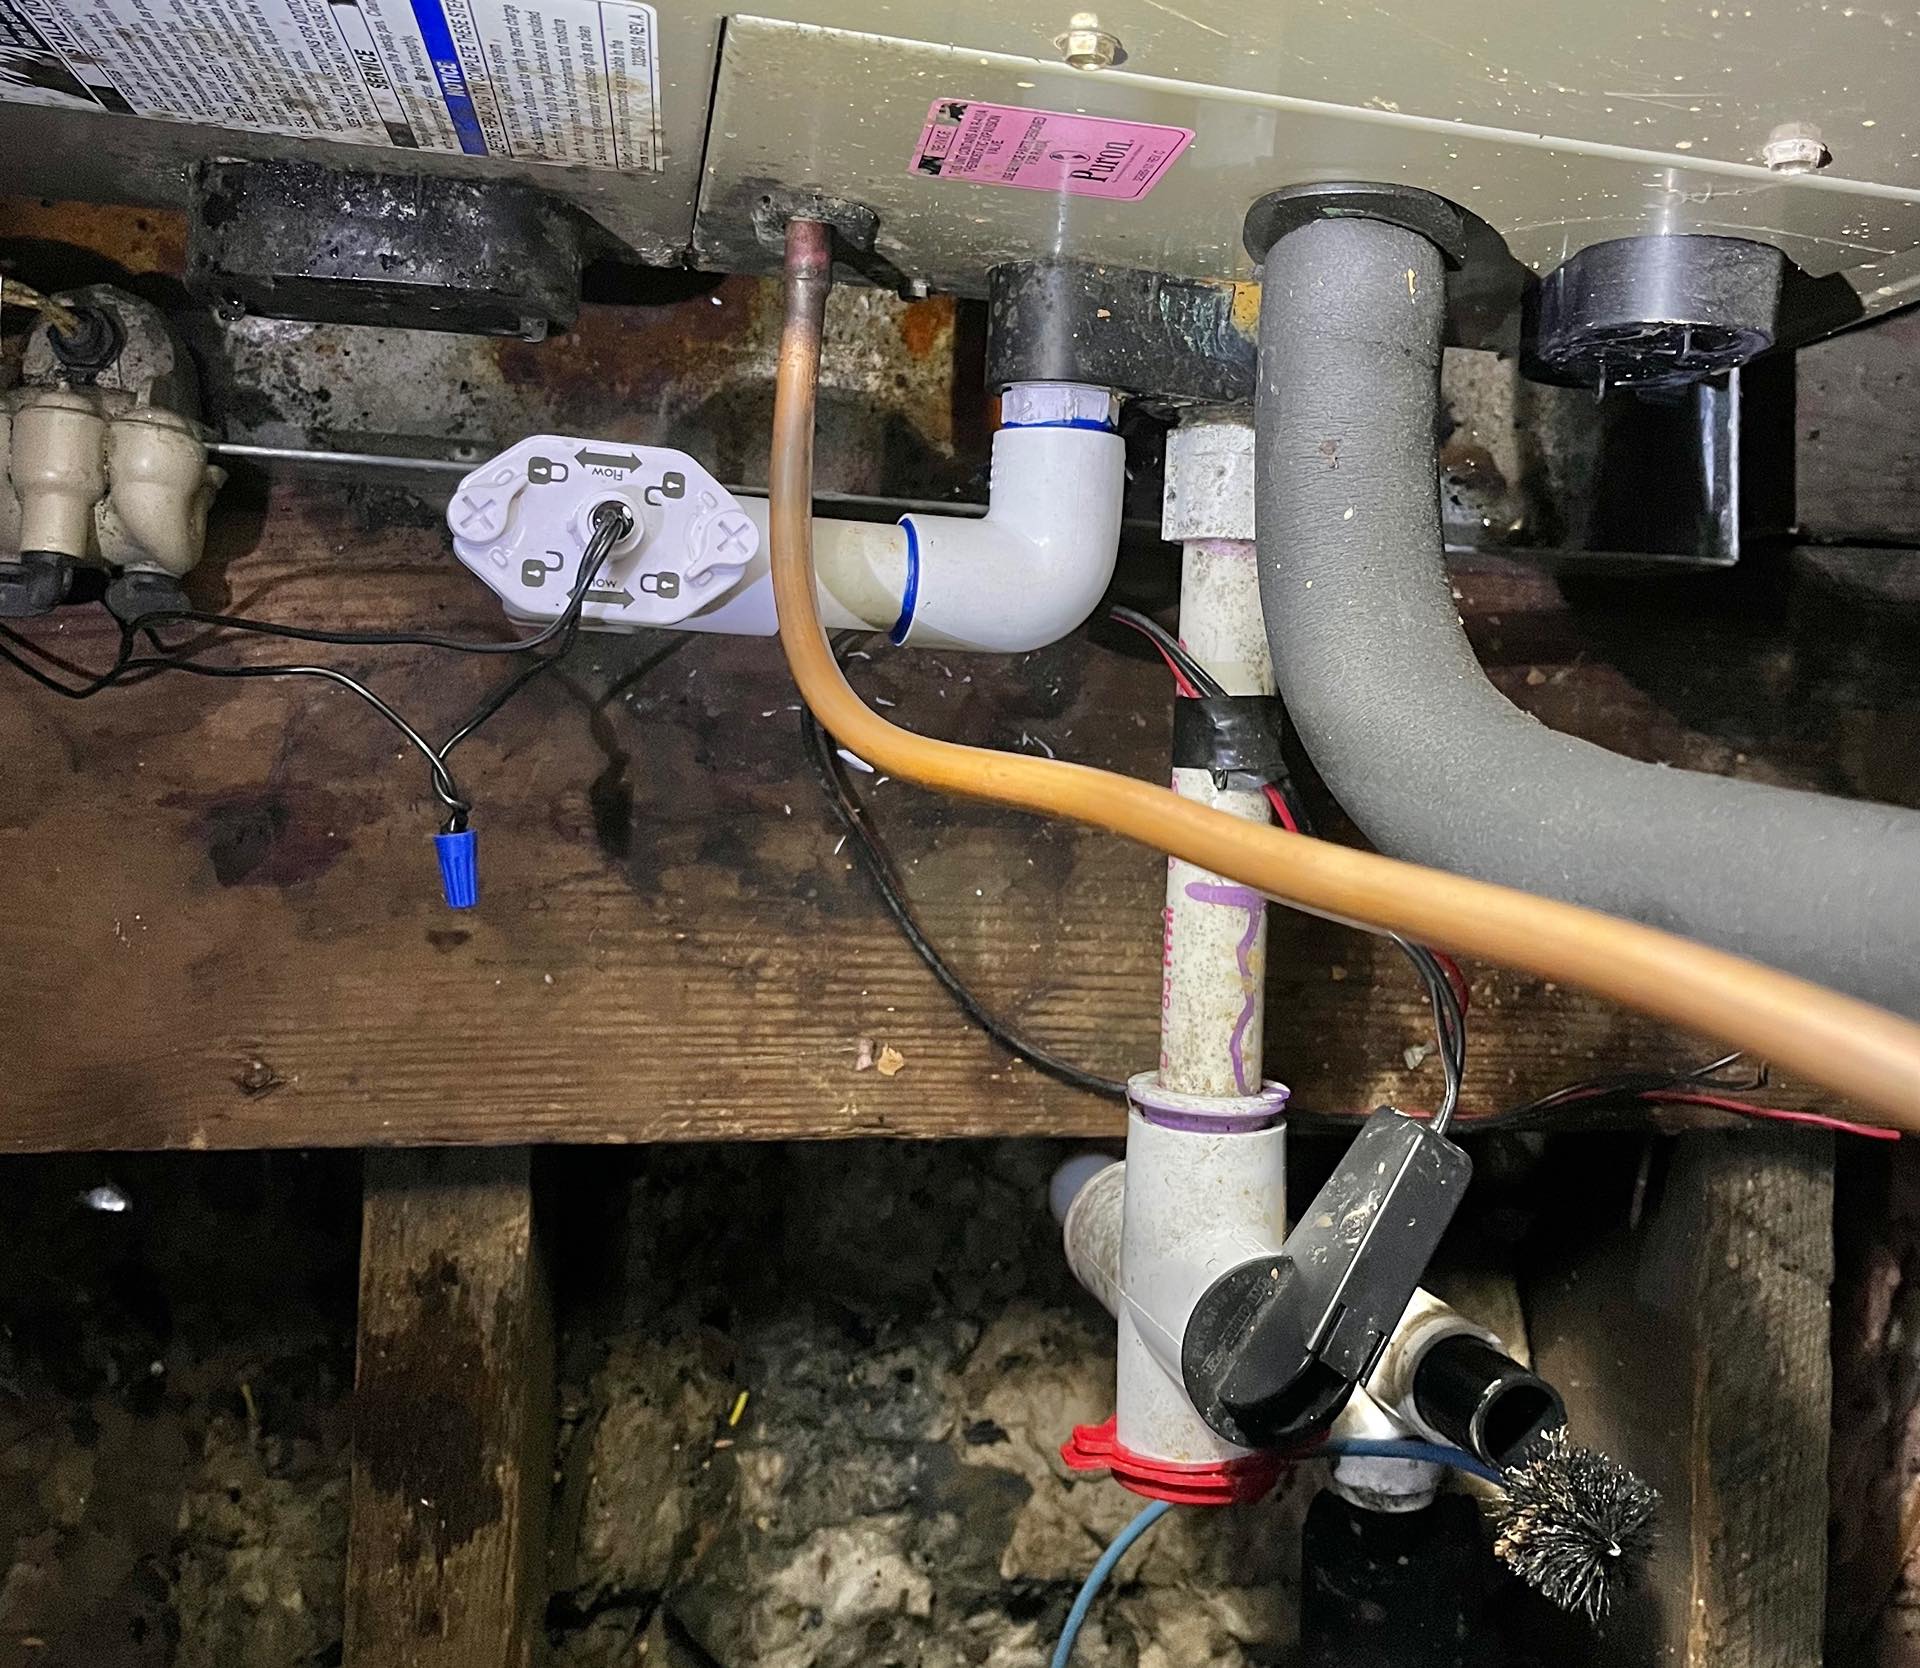
Air Conditioner
After a routine check on our air handler, which is in our attic, Chris noticed the emergency drain pan was filling with water. Not good! After multiple visits, it turned out we had multiple problems:
- The primary and secondary condensate drain pipes were clogged
Tech diagnosed a bad TXV (Thermal Expansion Valve)- Second opinion yielded that the TXV was good but the pressure was low
- Refilled with just over one pound of freon, likely a small leak exists
- Emergency pan and primary drain line float sensors were non-functional
- Replaced with newer electronic sensors
- Air handler internal (primary) drain pan had a crack; water was leaking into the unit/insulation
- Dried over several days of fan use
- Repaired the pan with marine tape to avoid the thousand-plus dollar replacement cost
Yeah, a lot. There was quite a bit of back and forth. We considered replacing the entire HVAC system. Quotes came in between $12-15K (including adding a heat pump). But, we’d like to hold off for another year if possible, since there’s some interaction with our larger community, which is changing our shared heating system.
Unfortunately, we’re not totally sure the whole system is working correctly, as it’s been in the 60s in Virginia with the fall weather. We did test the system on a few warmer days, and it seems to be working well, but we probably won’t really know until late spring.
AC repairs were $930.
Gutter Repair
We’ve had issues previously with our rear gutter and mentioned them here. Unfortunately, they persist. Again, we had water running down our back (brick) wall in sheets as the gutter seemed to fail. This yielded some water coming into our first-floor room as the water penetrated the brick over time. That’s probably an additional problem we need to tackle—perhaps some mortar is failing. But more immediately, we tried to get the gutter inspected and repaired.

Unfortunately, despite a recent gutter cleaning, our rear gutter had a clump of growth and debris blocking the downspout. This was underneath the gutter guards installed, which is probably why the cleaning didn’t catch the issue. No doubt, they were in a rush. This clog meant the water was running over the edges of the gutter during heavy rain and running down the wall.
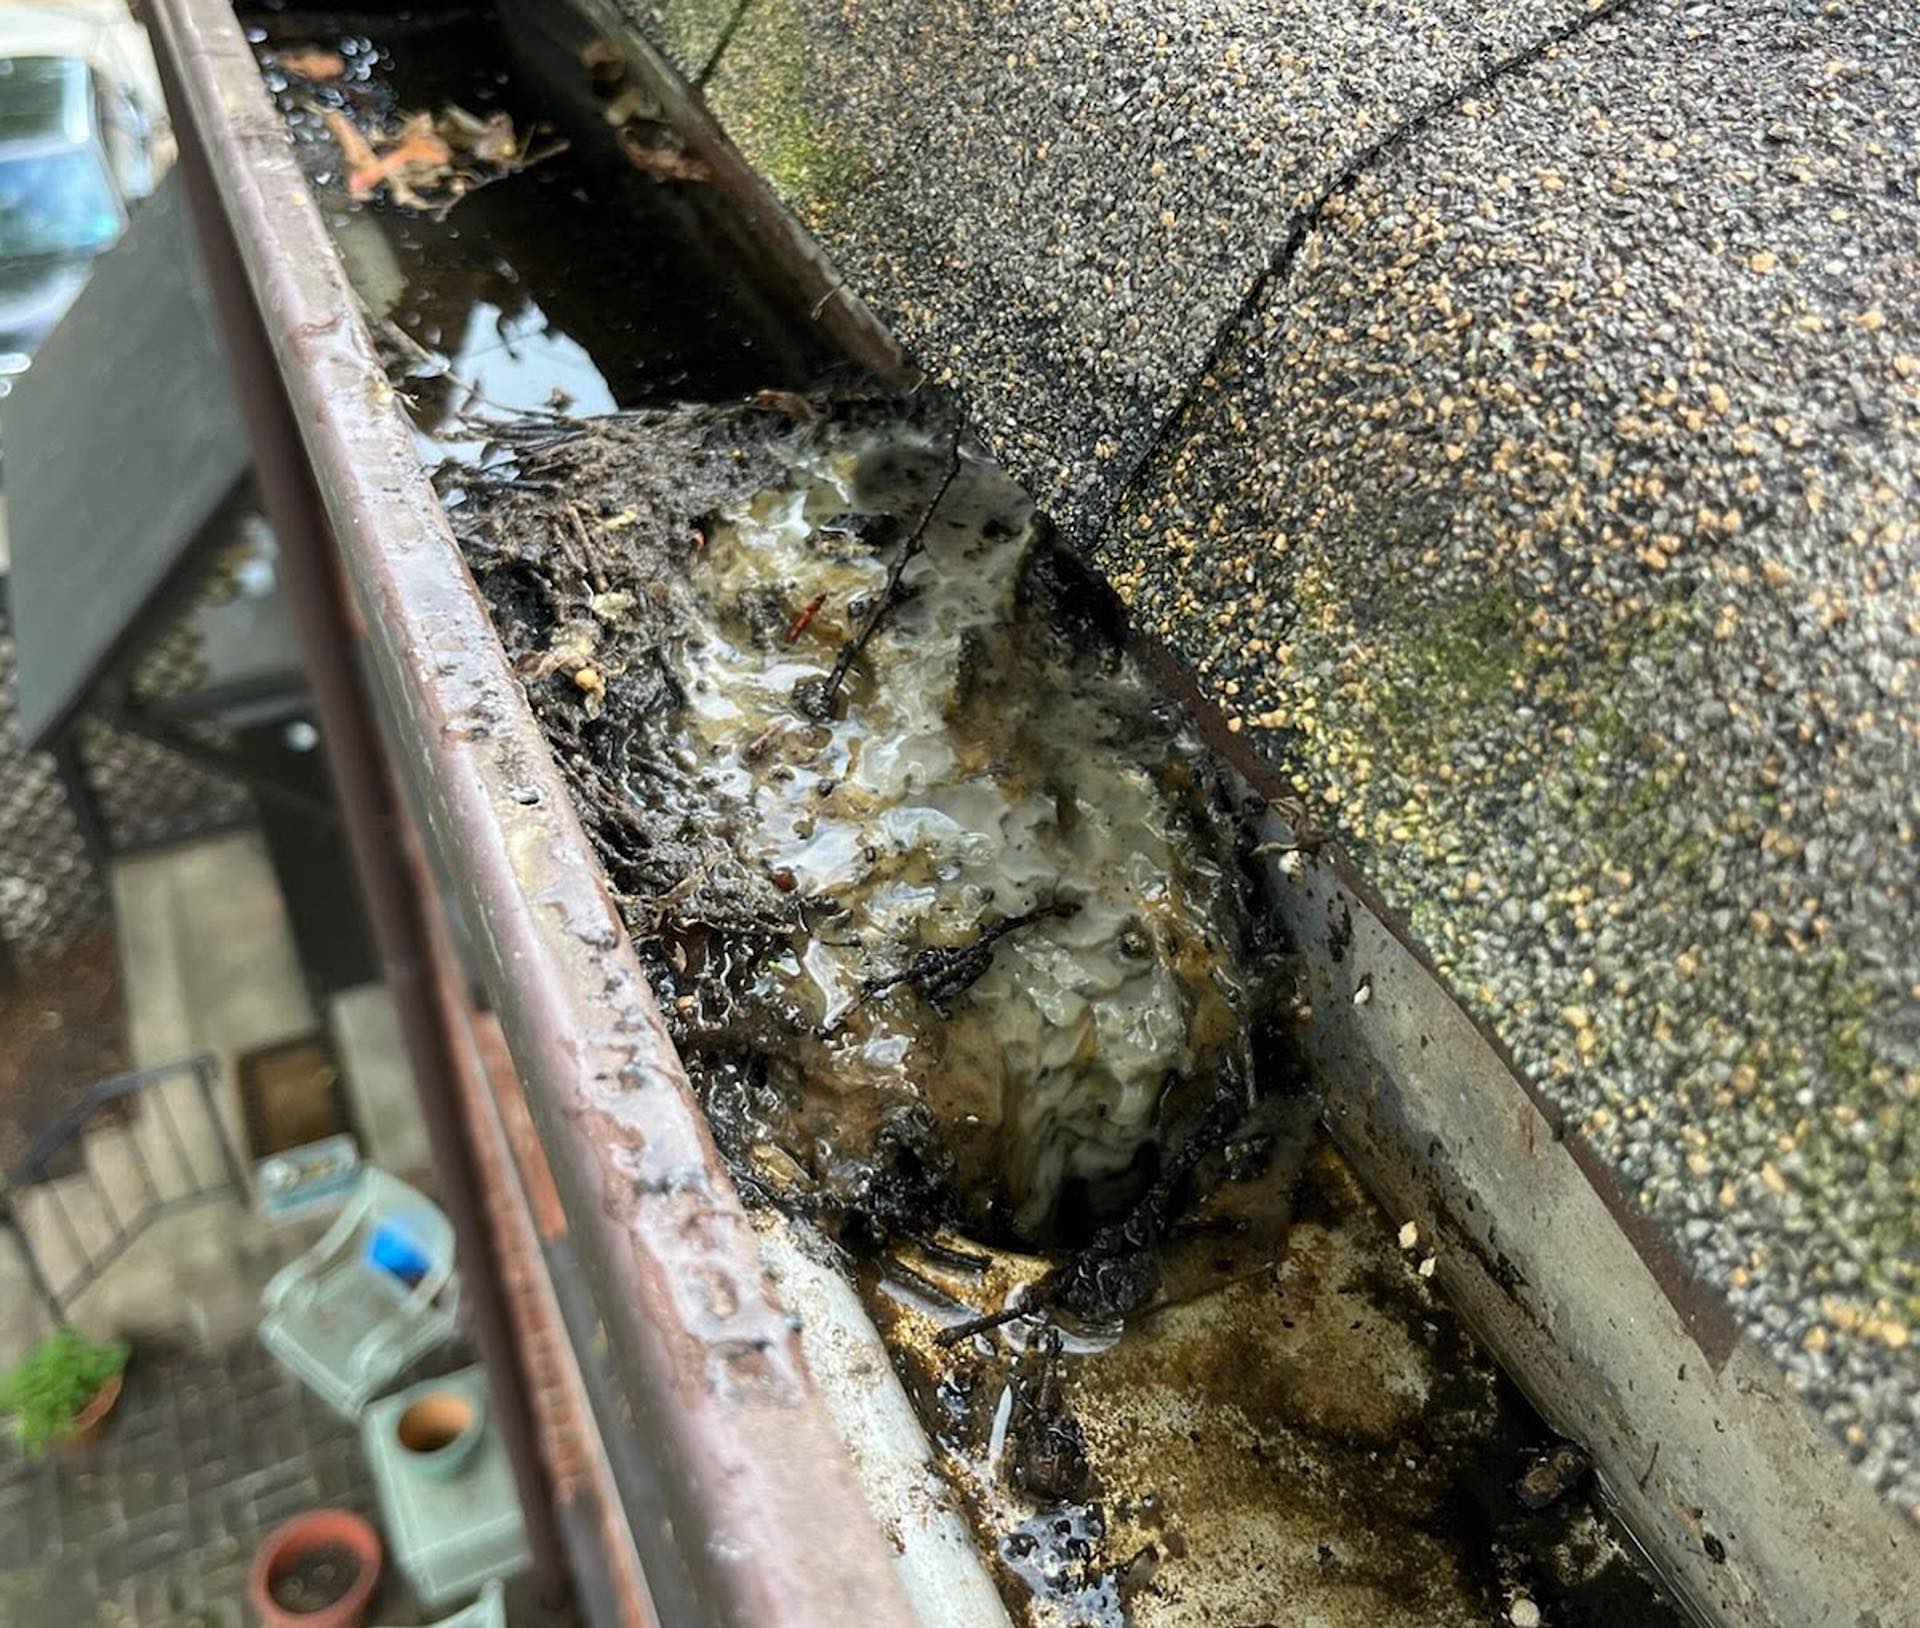
We had the gutter cleaned out of this buildup, a new gutter guard system installed that should work a bit better, and the gutter itself rehung to be a bit more aggressive.
After some review from the AC folks, the clump of growth in the gutter around the downspout was…almost certainly algae growth from the AC condensate lines that terminate into that same gutter. Fun!
Gutter repairs were $578.
Sink Drain Repair
We learned a valuable lesson this month. Fix the simple things before they become an even bigger problem. We haven’t had a drain stopper in our bathroom sink since the lift mechanism broke ten years ago.
Well, Jenni was really kicking herself for not getting this ten-dollar, easily replaceable part after she dropped a toothbrush cover down the drain. This led to a multi-day project of carefully attempting to dismantle the precisely positioned pipes to accommodate the small space behind the pedestal sink. We were on the verge of calling a plumber because we couldn’t get it reassembled without leaks.
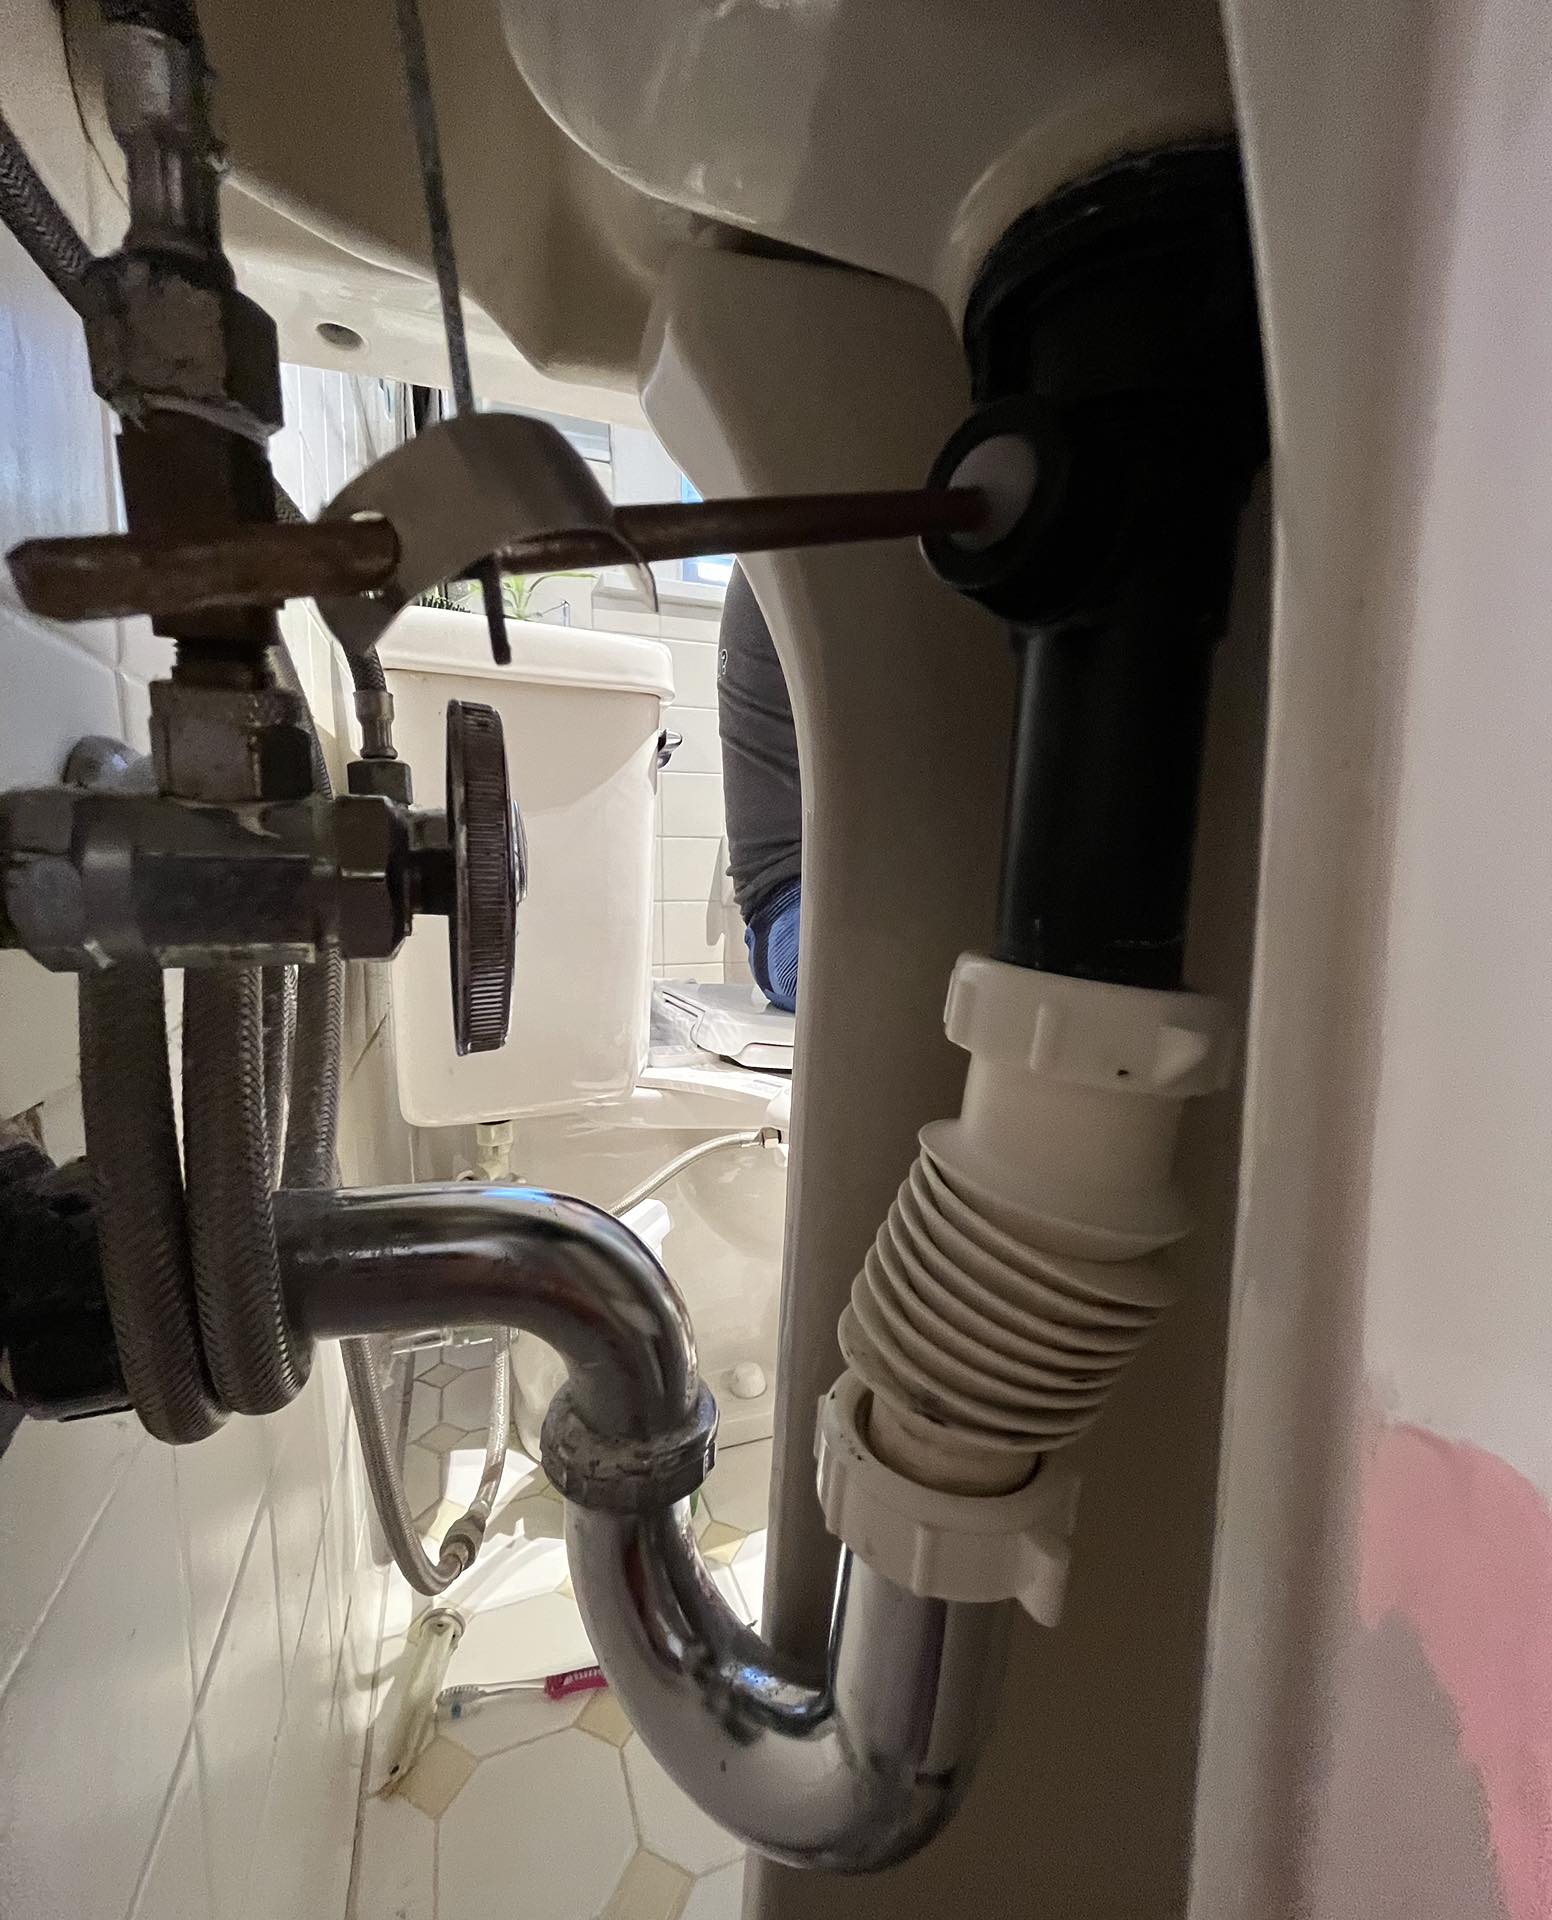
Finally, Jenni discovered that replacing the worn-out two-dollar drain washer, along with some plumbers’ putty, did the trick. Despite all this hassle, the toothbrush cover was nowhere to be found! At least now we have a freshly sealed drain and a properly functioning pop-up stopper.
Sink drain repair was $37.
We spent $2,847 on home expenses this month. Of this, $1,508 was on home improvement.
Expense Conclusion
While that covers the big stuff, we still had a few random things or small purchases to mention that might be of interest.
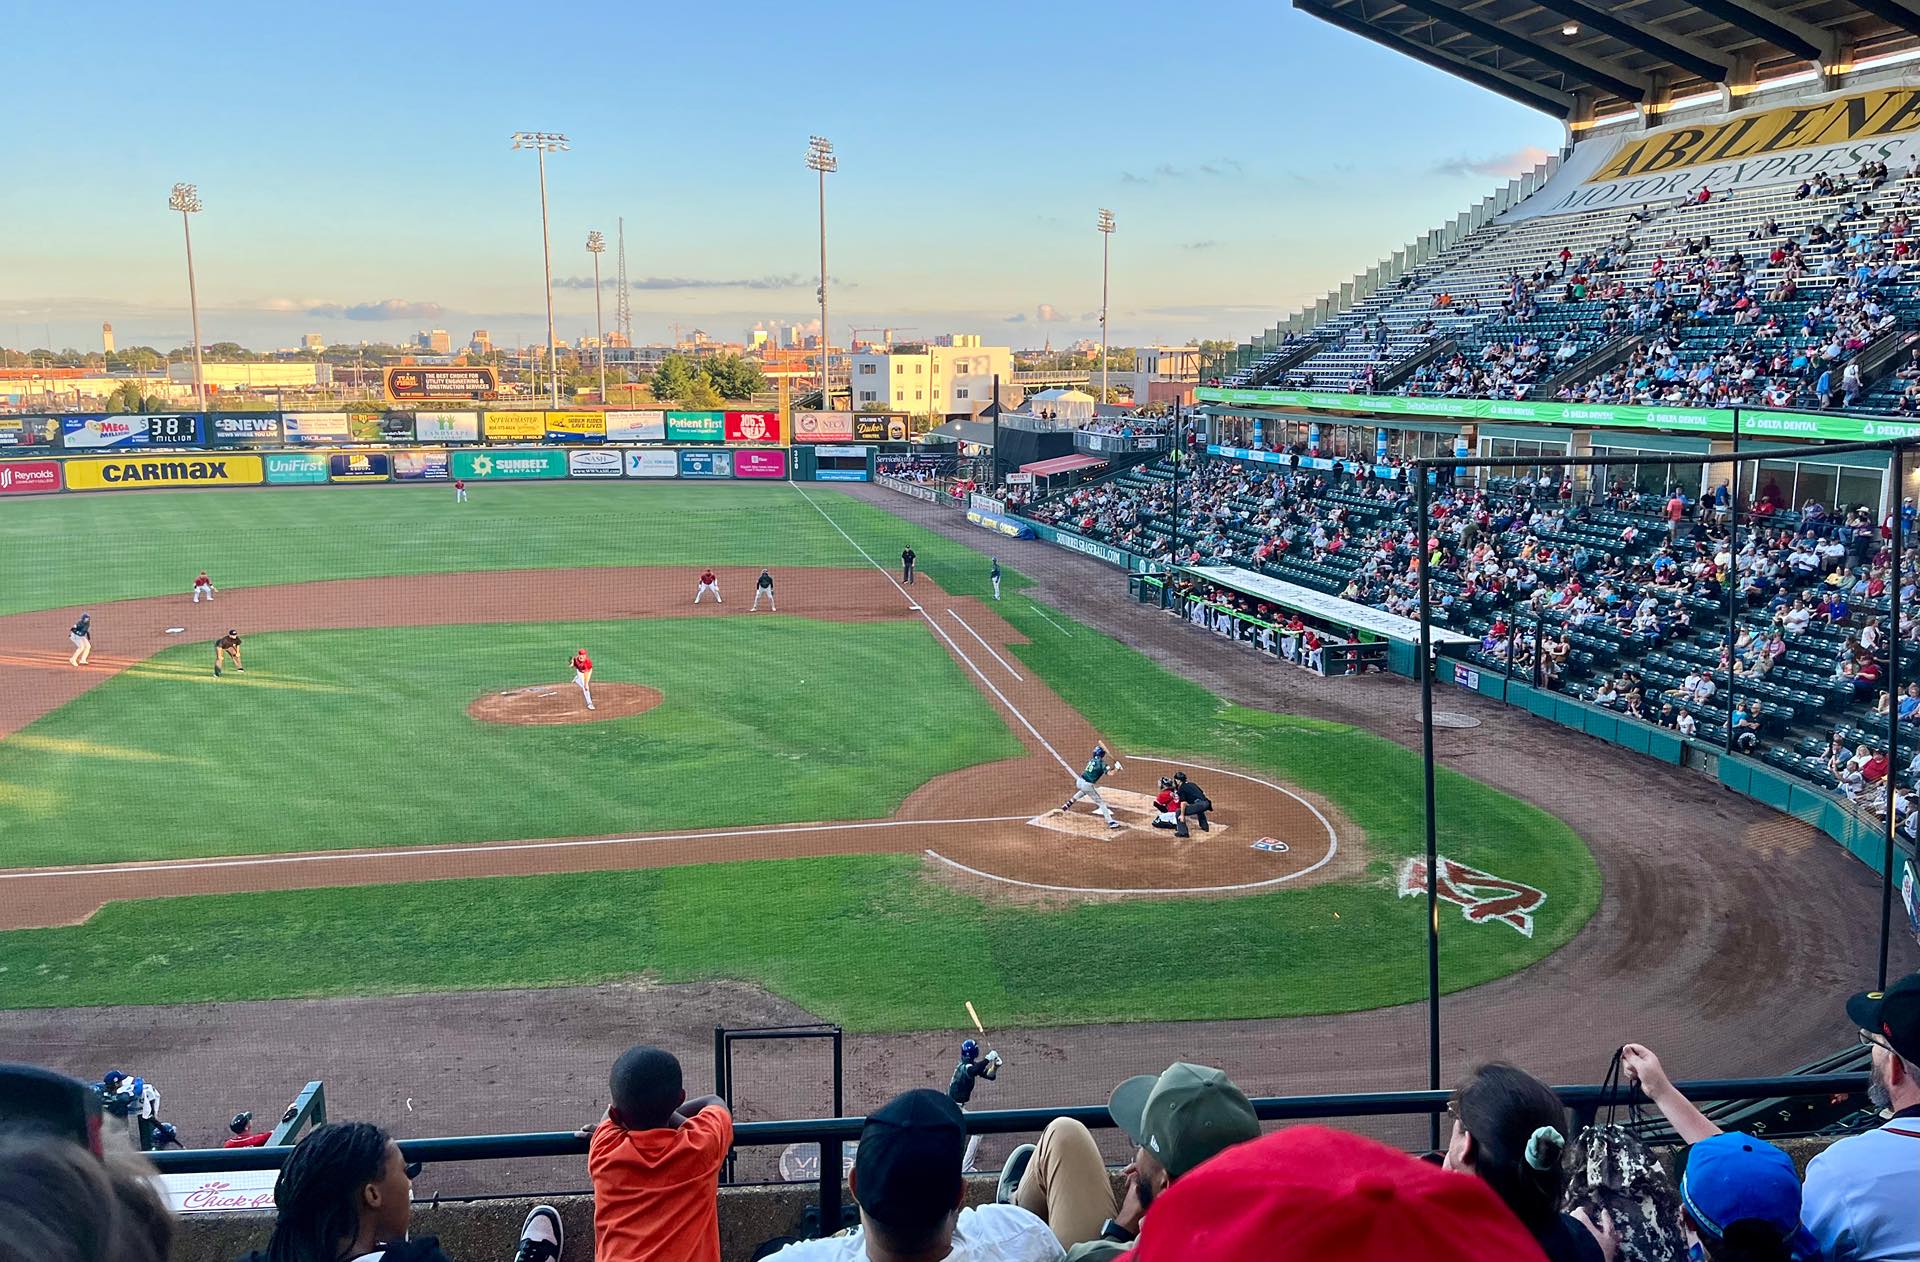
Amusement
We attended one of the last baseball games for our local team (“Flying Squirrels”) at the city’s stadium before it’s demolished. The games are always fun with these minor teams, plus, there’s a huge fireworks show at the end of most games. With it being one of the final games, the show was worth the admission price alone!
Tickets were $26 for two.
ⓘ Curious about some of the other expenses that we didn’t address? We’ve written about every expense in this month’s diagram either in this post or in the past. Check out our previous budget updates for more details or ask in the comments below!
How Much We Work
We like to keep track of how much time we spend doing work that is paid.
Let’s add this month to the list…
History of Monthly “Hours Worked”
| Month | Chris (Hours Worked) | Jenni (Hours Worked) |
|---|---|---|
| May 2020 | 41 | 108 |
| Jun 2020 | 38 | 96 |
| Jul 2020 | 36 | 120 |
| Aug 2020 | 39 | 48 |
| Sep 2020 | 27 | 76 |
| Oct 2020 | 26 | 104 |
| Nov 2020 | 27 | 57 |
| Dec 2020 | 28 | 57 |
| Jan 2021 | 25 | 102 |
| Feb 2021 | 24 | 104 |
| Mar 2021 | 24 | 106 |
| Apr 2021 | 23 | 85 |
| May 2021 | 17 | 29.75 |
| Jun 2021 | 19 | 66 |
| Jul 2021 | 21 | 30.25 |
| Aug 2021 | 23 | 16.5 |
| Sep 2021 | 26 | 28 |
| Oct 2021 | 22 | 49 |
| Nov 2021 | 21 | 51 |
| Dec 2021 | 64 | 27 |
| Jan 2022 | 32 | 80 |
| Feb 2022 | 29 | 63 |
| Mar 2022 | 14 | 70 |
| Apr 2022 | 15 | 21 |
| May 2022 | 14 | 36 |
| Jun 2022 | 6 | 12 |
| Jul 2022 | 13 | 45.5 |
| Aug 2022 | 15 | 96 |
| Sep 2022 | 12 | 54 |
| Oct 2022 | 14 | 34.5 |
| Nov 2022 | 12 | 72 |
| Dec 2022 | 11 | 16.5 |
| Jan 2023 | 10 | 88 |
| Feb 2023 | 11 | 81.5 |
| Mar 2023 | 12 | 47.5 |
| Apr 2023 | 8 | 1 |
| May 2023 | 16 | 100 |
| Jun 2023 | 10 | 109 |
| Jul 2023 | 12 | 48 |
| Aug 2023 | 16 | 54.5 |
| Sep 2023 | 9 | 20 |
| Oct 2023 | 14 | 22 |
| Nov 2023 | 15 | 22 |
| Dec 2023 | 16 | 12 |
| Jan 2024 | 12 | 61.25 |
| Feb 2024 | 14 | 28.5 |
| Mar 2024 | 16 | 61.5 |
| Apr 2024 | 12 | 22 |
| May 2024 | 8 | 19.5 |
| Jun 2024 | 18 | 19.5 |
| Jul 2024 | 14 | 44 |
| Aug 2024 | 18 | 81 |
| Sep 2024 | 15 | 20 |
| Oct 2024 | 18 | 51 |
| Nov 2024 | 5 | 15 |
| Dec 2024 | 19 | 12 |
| Jan 2025 | 17 | 17.5 |
| Feb 2025 | 4 | 8 |
| Mar 2025 | 14 | 12 |
| Apr 2025 | 3 | 11 |
| May 2025 | 14 | 33 |
| Jun 2025 | 12 | 2 |
| Jul 2025 | 12 | 13 |
| Aug 2025 | 16 | 13.5 |
| Sep 2025 | 12 | 30 |
Being home, Jenni worked a little more this month. Still, we continue to keep things very much “part-time” at 42 hours total between the two of us.
Net Worth Update
Net worth is not our primary measurement, and can understand it can be discouraging if you’re working yourself out of debt. We also understand it’s difficult to be transparent with our readers without divulging this information, so we continue to do so.
Account breakdown
Even with the wild swings in the market lately, our investments continue to be pretty stable. From a high level, our assets and liabilities are shown in the data table below as of September 30, 2025.
| Description | Value (USD, $) |
|---|---|
| 401(k) | 1,199,547 |
| Brokerage | 1,063,453 |
| Roth IRA | 262,093 |
| Traditional IRA | 44,958 |
| HSA | 70,849 |
| Real Estate | 461,200 |
| Mortgage | (130,501) |
| Miscellaneous Assets | 25,000 |
| Checking & Savings | 15,437 |
| Net Worth | 3,012,036 |
- Miscellaneous assets include specific investments we’ve made in physical assets (think collectibles) and treasury bonds
- Amounts do not reflect the value of the businesses Chris owns or their assets, which should appear as income to us over future years
- Jenni’s Prius is omitted
The S&P 500 was up about 3.5% for the month.
We were up about 3.3%. That’s quite close to matching the market, which we’re happy with.
Overall, our net worth increased by around $96K this month.
Net Worth History
| Date | Amount | % Change |
|---|---|---|
| July 2020 | $1,555,289 | – |
| August 2020 | $1,597,334 | 2.7% |
| September 2020 | $1,566,393 | (2.0%) |
| October 2020 | $1,568,182 | 0.01% |
| November 2020 | $1,720,113 | 9.6% |
| December 2020 | $1,810,864 | 5.3% |
| January 2021 | $1,860,996 | 2.8% |
| February 2021 | $1,878,154 | 0.9% |
| March 2021 | $1,918,269 | 2.1% |
| April 2021 | $2,010,849 | 4.8% |
| May 2021 | $2,049,213 | 1.9% |
| June 2021 | $2,093,896 | 2.2% |
| July 2021 | $2,092,153 | (0.1%) |
| August 2021 | $2,130,761 | 1.8% |
| September 2021 | $2,070,730 | (2.8%) |
| October 2021 | $2,151,272 | 3.9% |
| November 2021 | $2,095,273 | (2.6%) |
| December 2021 | $2,160,235 | 3.1% |
| January 2022 | $2,055,292 | (4.9%) |
| February 2022 | $2,058,001 | 0.01% |
| March 2022 | $2,134,428 | 3.7% |
| April 2022 | $1,968,069 | (7.8%) |
| May 2022 | $1,975,569 | 0.04% |
| June 2022 | $1,868,397 | (5.4%) |
| July 2022 | $1,975,608 | 5.7% |
| August 2022 | $1,878,352 | (5.2%) |
| September 2022 | $1,735,997 | (7.6%) |
| October 2022 | $1,820,287 | 4.9% |
| November 2022 | $1,920,635 | 5.5% |
| December 2022 | $1,866,513 | (2.8%) |
| January 2023 | $1,953,691 | 4.7% |
| February 2023 | $1,882,656 | (3.6%) |
| March 2023 | $1,969,566 | 4.6% |
| April 2023 | $1,981,934 | 0.6% |
| May 2023 | $1,995,247 | 0.7% |
| June 2023 | $2,092,479 | 4.9% |
| July 2023 | $2,189,821 | 4.7% |
| August 2023 | $2,140,296 | (2.2%) |
| September 2023 | $2,042,865 | (4.6%) |
| October 2023 | $2,015,648 | (1.3%) |
| November 2023 | $2,157,404 | 7.0% |
| December 2023 | $2,261,458 | 4.8% |
| January 2024 | $2,296,269 | 1.5% |
| February 2024 | $2,365,110 | 3.0% |
| March 2024 | $2,434,250 | 2.9% |
| April 2024 | $2,371,284 | (2.6%) |
| May 2024 | $2,423,205 | 2.2% |
| June 2024 | $2,472,353 | 2.0% |
| July 2024 | $2,513,877 | 1.7% |
| August 2024 | $2,560,215 | 1.8% |
| September 2024 | $2,592,558 | 1.3% |
| October 2024 | $2,576,903 | (0.6%) |
| November 2024 | $2,685,615 | 4.2% |
| December 2024 | $2,621,732 | (2.4%) |
| January 2025 | $2,689,706 | 2.6% |
| February 2025 | $2,665,053 | (0.9%) |
| March 2025 | $2,581,708 | (3.1%) |
| April 2025 | $2,588,737 | 0.3% |
| May 2025 | $2,711,140 | 4.7% |
| June 2025 | $2,818,049 | 3.9% |
| July 2025 | $2,836,370 | 0.7% |
| August 2025 | $2,915,960 | 2.8% |
| September 2025 | $3,012,036 | 3.3% |
Previous Donation Winner
It is always nice to feel appreciated, and that is just what our poll winner, Soldiers’ Angels, does for our active service members, their families, and veterans around the globe. The cards and care packages sent to these hardworking individuals provide just a little extra thanks for all their dedication and service.
Our Reader’s Fund seeks to leverage the principles of FIRE to build a lifetime of giving.
Thank you for your participation in our polls over the last 4 years. We’ve given over $8,600 to deserving charities with your help in deciding which organizations to donate to.
Polls are now open for our next round of candidates: Clean Water Charities.
Charity Round-Up
Water is the foundation of life. We all use it every day, from staying hydrated, washing clothes or dishes, keeping up with hygiene, and even flushing the toilets. Now imagine if that water wasn’t clean or wasn’t from a reliable source. It would be a guessing game every day you tried to turn that faucet on, and not a fun one!
Each of these organizations is helping to ensure everyone has a source of clean water to drink and stay healthy for the long run. They each have great charity ratings. We invite you to learn more about great work around the world and join us in donating to one of them by casting your vote.
Summaries below include the impact metrics and a link to their Candid profile, which details the nonprofit’s operations and transparency.
1) International Orthodox Christian Charities (IOCC)
Why? In addition to responding to emergencies, this organization promotes health through sanitation and hygiene programs and creates access to clean water stations.
Where? Globally.
What? International Orthodox Christian Charities (IOCC) is an international humanitarian relief organization. It does work in cooperation with the Orthodox Church, but all funds collected by the agency are only used for humanitarian aid, not missionary work. They help families in times of need, from all walks of life, to build sustainable programs, to improve agricultural production, to improve health through education and prevention, and to maintain access to clean water to improve their overall lives. Their focus on water includes:
- Drilling new wells and replacing or repairing water lines
- Installing sanitation stations in school bathrooms
- Placing water purification systems
- Education on hygiene and food preparation
- Community involvement in maintaining the systems put in place
2) Living Water International
Why? 2.3 billion people live in water-stressed countries, making it difficult to efficiently grow crops, stay healthy, go to school, or do anything besides walking for miles to get the only water available every day. Their W.A.S.H. program solely focuses on implementing water, sanitation, and hygiene solutions.
Where? India, Mexico, Africa, Asia, Europe, South America, and Central America.
What? Living Water International is a faith-based non-profit organization bringing clean water to 27 countries around the world. They strategically seek out areas of the highest need to implement their W.A.S.H. programs. These include areas with high water-related diseases, poor school attendance due to lack of local water access, safety of women traveling to get water miles away, and an evaluation of the economic impact of not having water. After assessing the baseline water, sanitation, and hygiene situations, goals are set and the W.A.S.H. program is implemented. Wells are drilled, water purification systems are installed, and hygiene stations are built in the communities. Their teams monitor and collect data for 5-7 years to ensure they are on track and continuously improve the programs at each new location.
3) WaterAid
Why? They work with communities to ensure they have clean water today, but also systems and policies in place so there will be clean water for the future.
Where? Colombia, Africa, and Asia.
Our Notes: WaterAid is an international organization established in 1981during The Thirsty Third World Conference in the UK. The goal was to help the millions of people living without clean water, functioning toilets, or good hygiene. As of 2022, they have reached 28.5 million people with clean water, 28.8 million people with functioning toilets, and 26 million people with good hygiene. They do this by implementing sustainable solutions by working with the local communities and governments to identify the problems. Grants and donations fund the installation of deep wells or rainwater harvesting tanks with solar-powered pumps, depending on the needs. Next are health and hygiene campaigns to educate and practice proper hygiene and understand the connection with health and cleanliness. The success of these programs then leads the surrounding neighborhoods to want to join in the action, eventually electing officials who have this need top of their mind to continue the infrastructure changes.
Nonprofit poll
After reviewing the list above, please take a moment to vote for which nonprofit you think will put funds to use in the best way.
(Have trouble using or seeing the poll above? Some reader tools or apps may not display it. View this page in a browser or use this link to our Reader Fund page, which has a copy of the poll!)
Thank you for taking the time to vote!
One of our primary goals with TicTocLife is building a stream of giving within the FIRE community, and that starts with knowledge.
Want to hear about the results? Sign up for our free FIRE Insider newsletter! We send it out every few weeks and include the monthly poll results and donation winners. You can see an archive of the FIRE Insider and sign up here!
What’s Next
We continue to dig into our investments to fund our lives, which, while increasing in frequency—is certainly part of our FIRE plan. As our income trails off from part-time work and liquidating business assets, our costs are going up with inflation and life’s adventures. Thankfully, our finances easily cover this disparity, and we’re in it for the long haul. Still, it’s a noticeable change to see investment sales income balancing our monthly budget. That’ll continue, no doubt.
October should continue our recent time in Virginia with friends, family, and local adventure. It’s a lovely time of year with the changing leaves and special events around town. A moment to soak in some of the beauty that financial independence affords us to enjoy.
What’ve you got planned for the changing season?
Let us know in the comments or on Threads and X (Twitter)!

2 replies on “Houses and Water Problems (Sep. 2025 Update)”
It”s crazy how I’ve followed you guys and other’s for years, and the net worth keeps going UP despite being “retired”, though I know Jenni continues to work. Incredible job, and thank you for sharing and being consistent. Also, homeownership is fun isn’t it??
Hey Gary! Great to hear from you.
Yep, it does keep going up! Pretty wonderful for us, but I don’t think it’s normal. The market seems a little frothy. Still, we don’t pretend to be savants so *time in the market* it is. Jenni continues to work despite the lack of need—at least, financially. She likes it!
And thanks for the compliments! I’m sad we’re not *more* consistent, but we’re trying to get there. We’ve had a big project going on in the background that has sucked up a lot of time. We’ll have a big discussion about that in the coming month.
Phew…homeownership. It’s always something. But I’m glad we fix it the way we need to, rather than being at the hands of someone else’s idea of proper fixing. Heh. Cheers!